Economics
Macroeconomics, IMF data, global economic trends and sovereign finance
96 articles
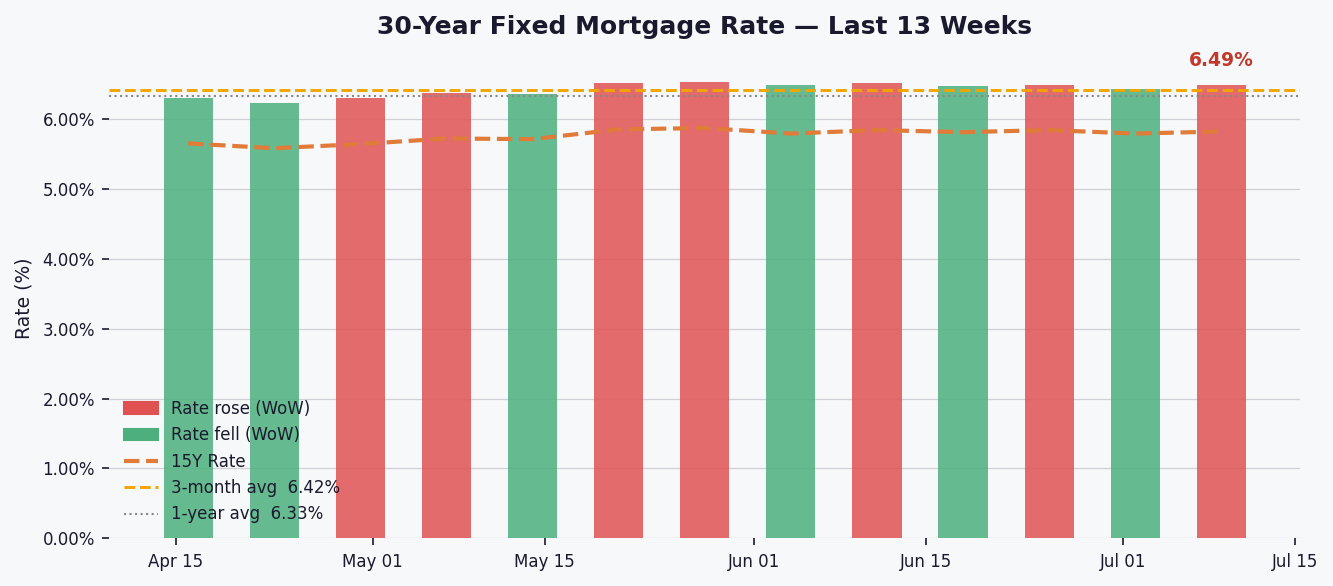
Mortgage rates climb to 6.49%, adding $41 to monthly payments on a $400k loan
The 30-year fixed mortgage rate rose 6 basis points this week to 6.49%, pushing the monthly payment on a $400,000 loan to $2,526 — $41 higher than a year ago as borrowing costs continue their upward trend.
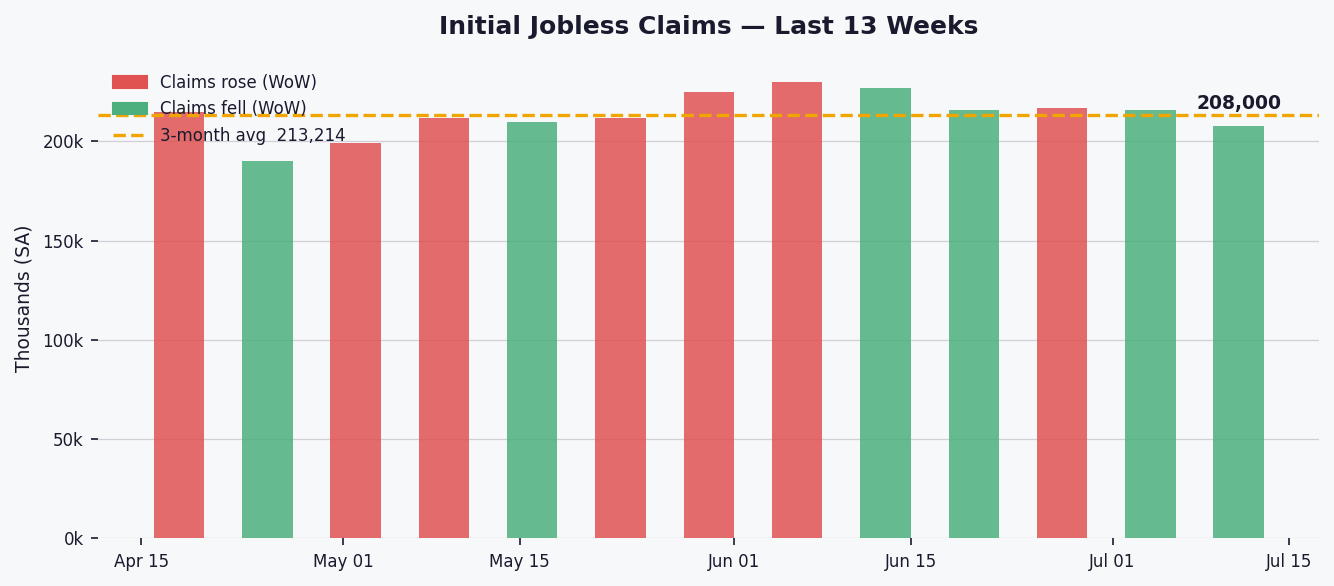
US jobless claims dip to 208,000, signaling steady labor market
Initial jobless claims fell by 8,000 to 208,000 last week, a 3.7% drop from the previous week, reflecting ongoing stability in the US labor market.
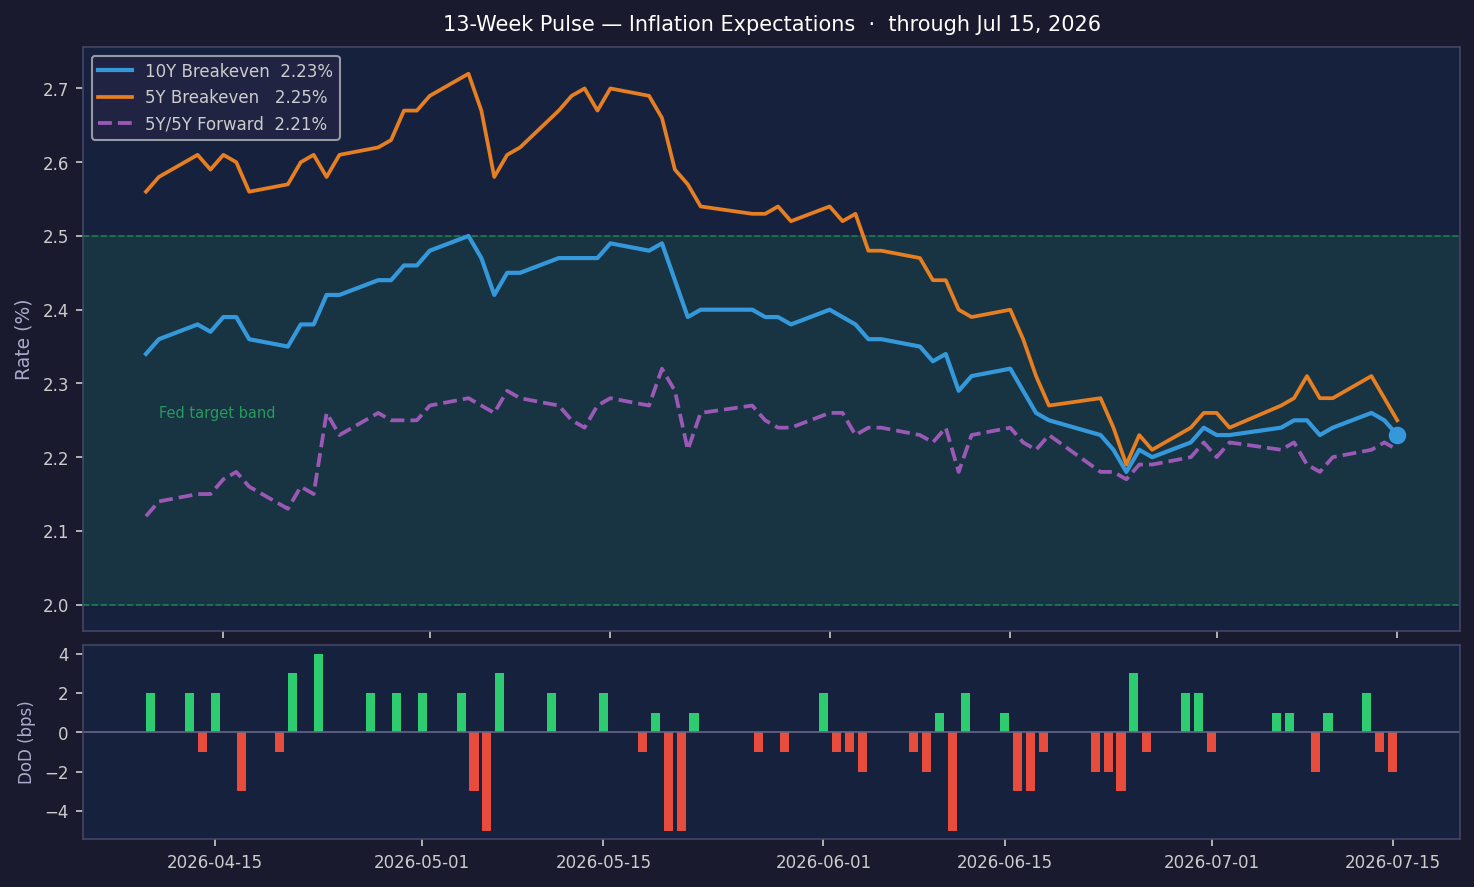
10Y Breakeven Holds at 2.23% as Inflation Stays On Target
The breakeven inflation rate equals the yield gap between a conventional Treasury and a TIPS of the same maturity. If the 10Y nominal yields 4.50% and the 10Y TIPS yields 2.00%, the 10Y breakeven is 2.50% — the level of average CPI at which an investor is indifferent between the
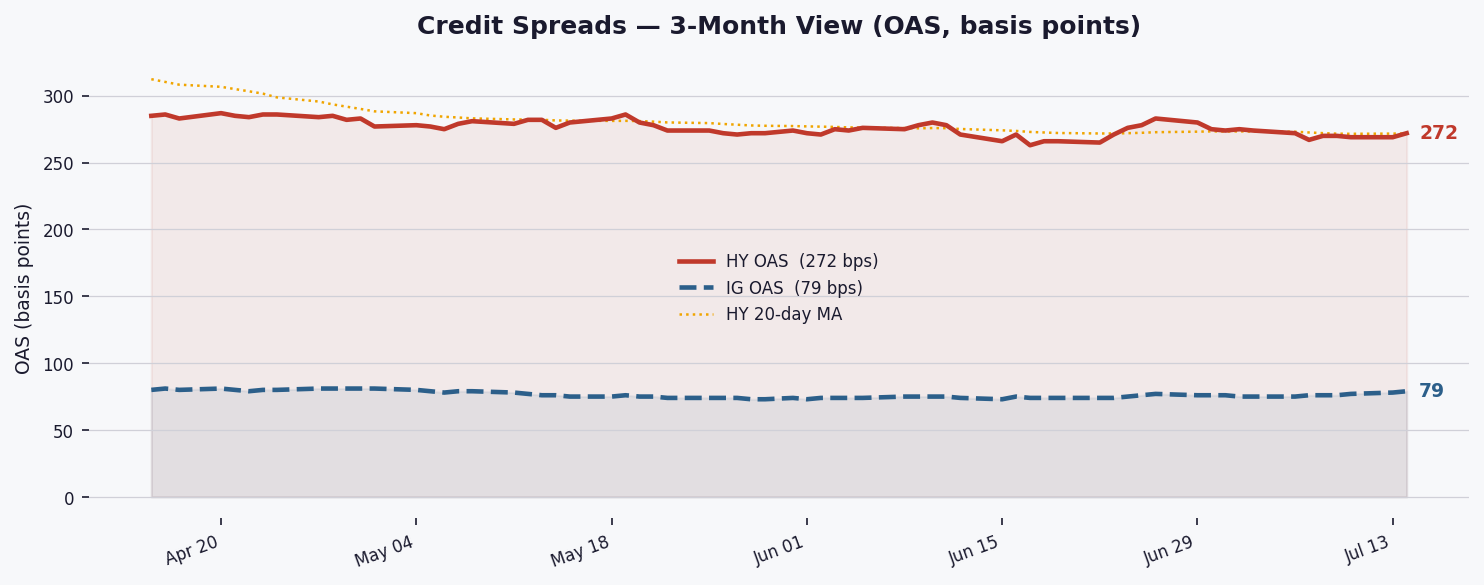
HY spreads widen to 272 bps as risk appetite cools amid tightening regime
High-yield spreads rose 3 bps to 272 bps today, extending the week's 5 bps widening in a NORMAL but tightening regime, signaling cautious investor sentiment ahead of key economic data.
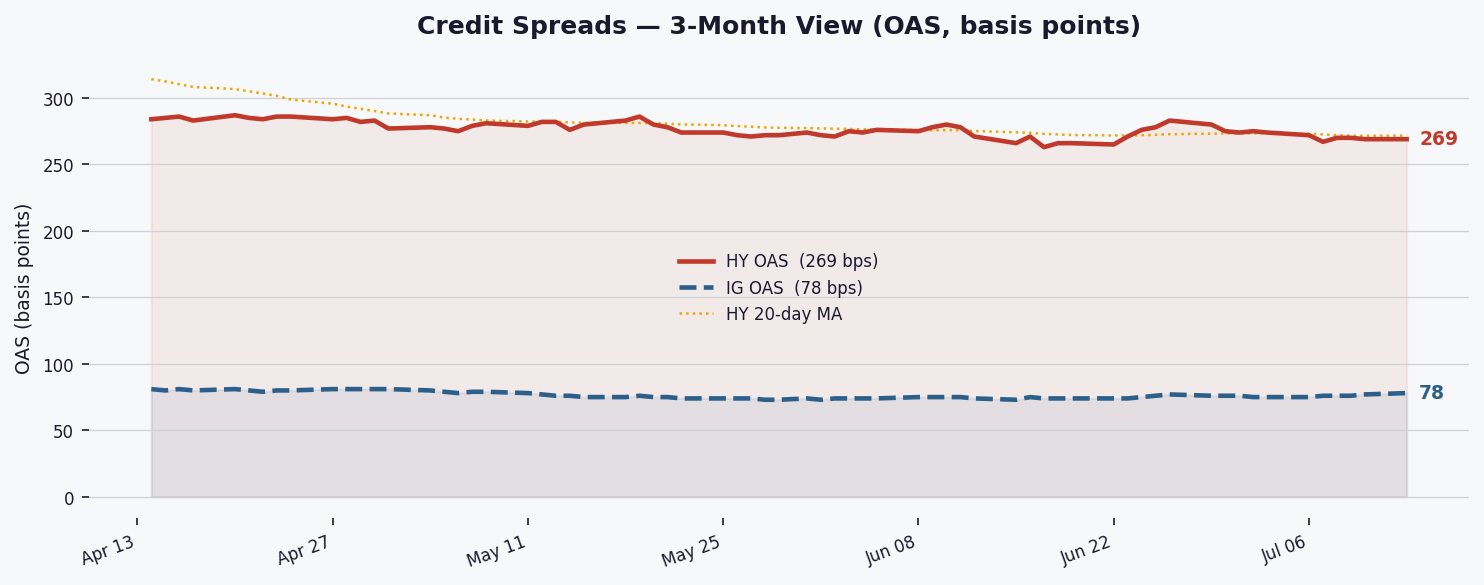
HY spreads hold at 269 bps as markets await catalysts amid tightening trend
High-yield spreads remained flat at 269 bps today, holding in a NORMAL regime with tightening momentum, suggesting cautious optimism but limited risk appetite ahead of key economic data.
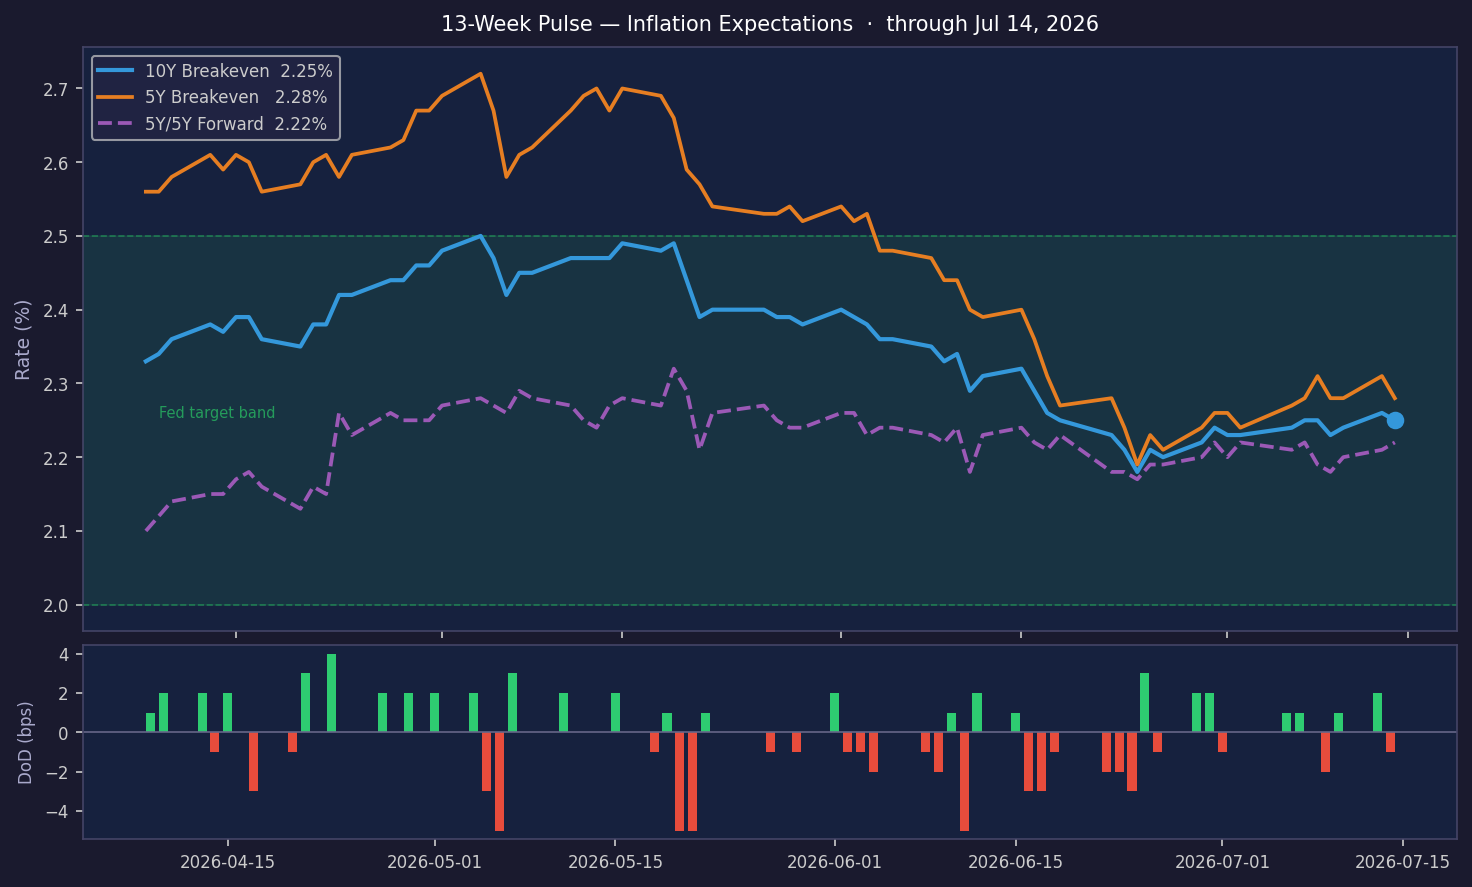
10Y Breakeven Holds at 2.25% as Inflation Stays On Target
The breakeven inflation rate equals the yield gap between a conventional Treasury and a TIPS of the same maturity. If the 10Y nominal yields 4.50% and the 10Y TIPS yields 2.00%, the 10Y breakeven is 2.50% — the level of average CPI at which an investor is indifferent between the
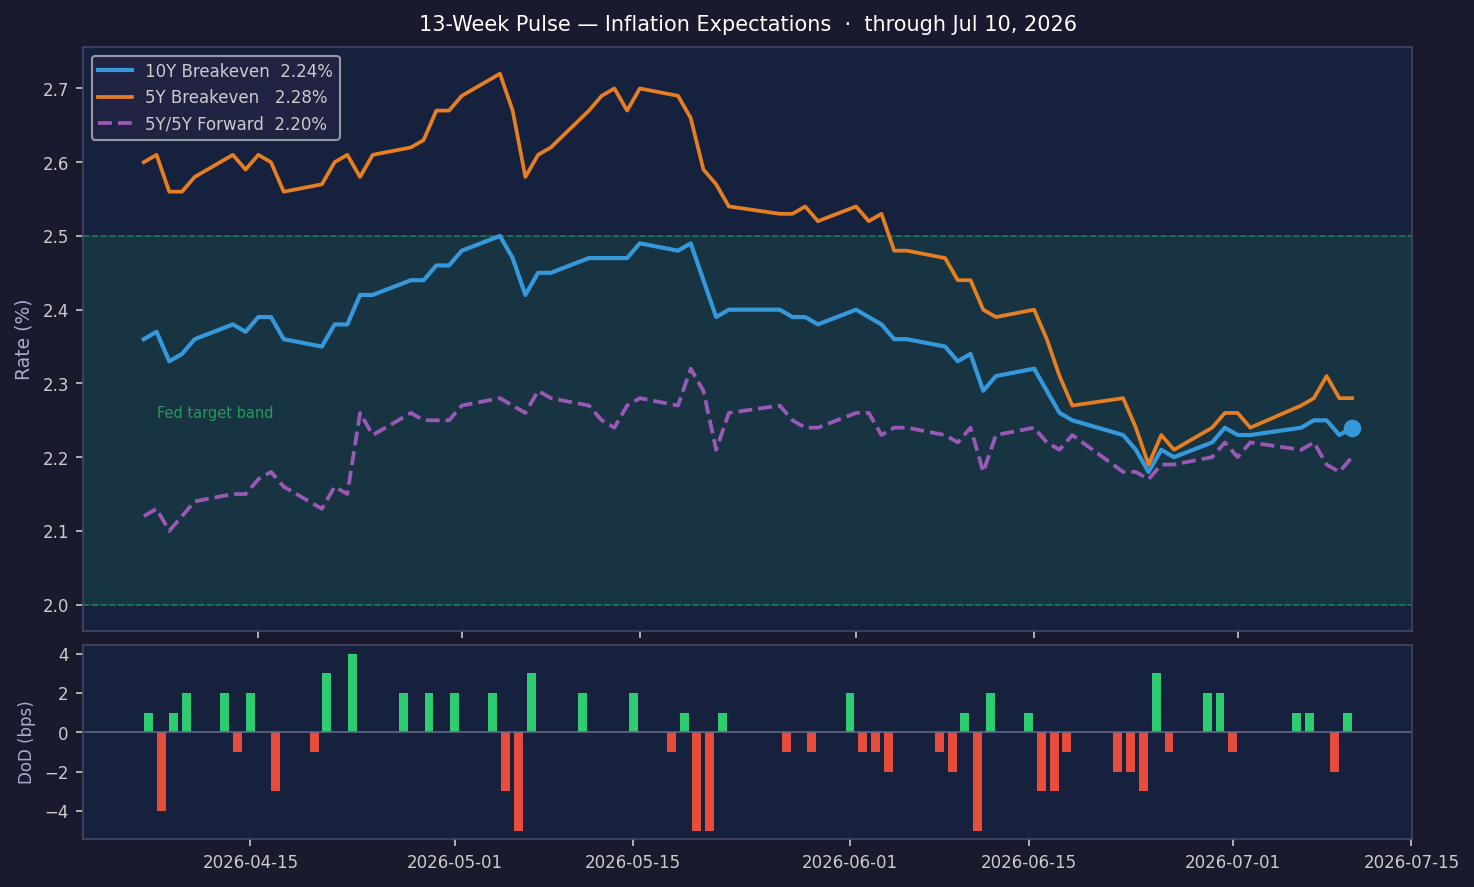
10Y Breakeven Hits 2.24%, Inflation On Target, Up 1.0 bps
The breakeven inflation rate equals the yield gap between a conventional Treasury and a TIPS of the same maturity. If the 10Y nominal yields 4.50% and the 10Y TIPS yields 2.00%, the 10Y breakeven is 2.50% — the level of average CPI at which an investor is indifferent between the
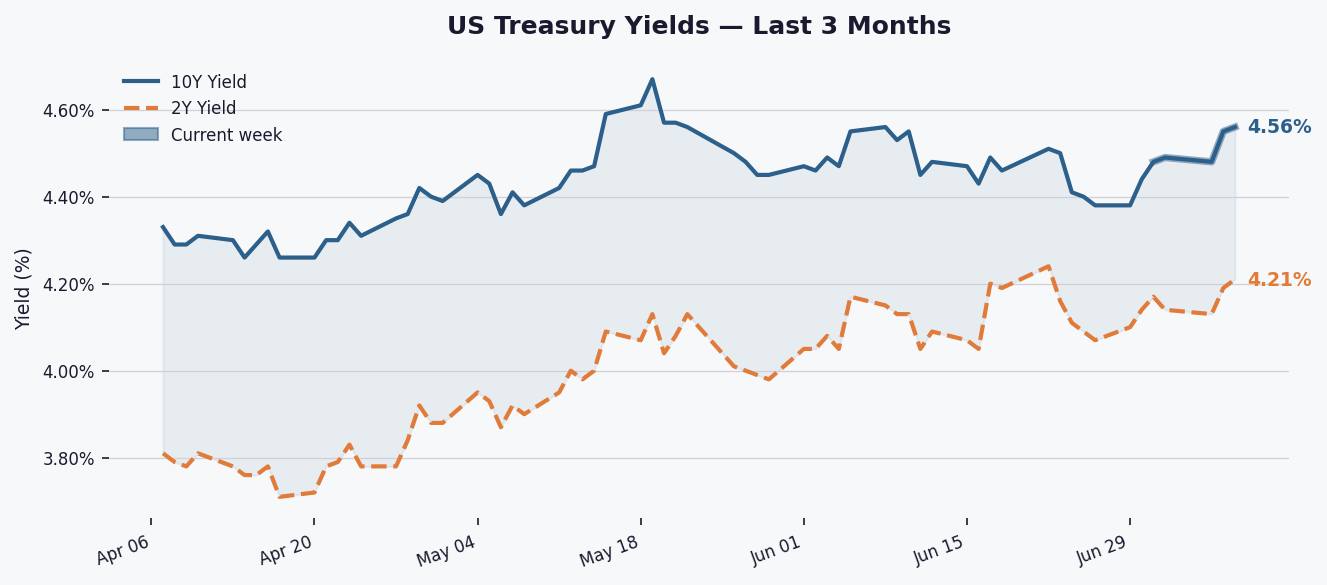
10Y Yields Rise 12 Bps to 4.56% as Curve Steepens Further
The 10-year Treasury yield climbed 12 basis points this week to settle at 4.56%, extending its 2026 uptrend while the 2Y-10Y spread widened to +38 bps, reinforcing a positive curve signal.
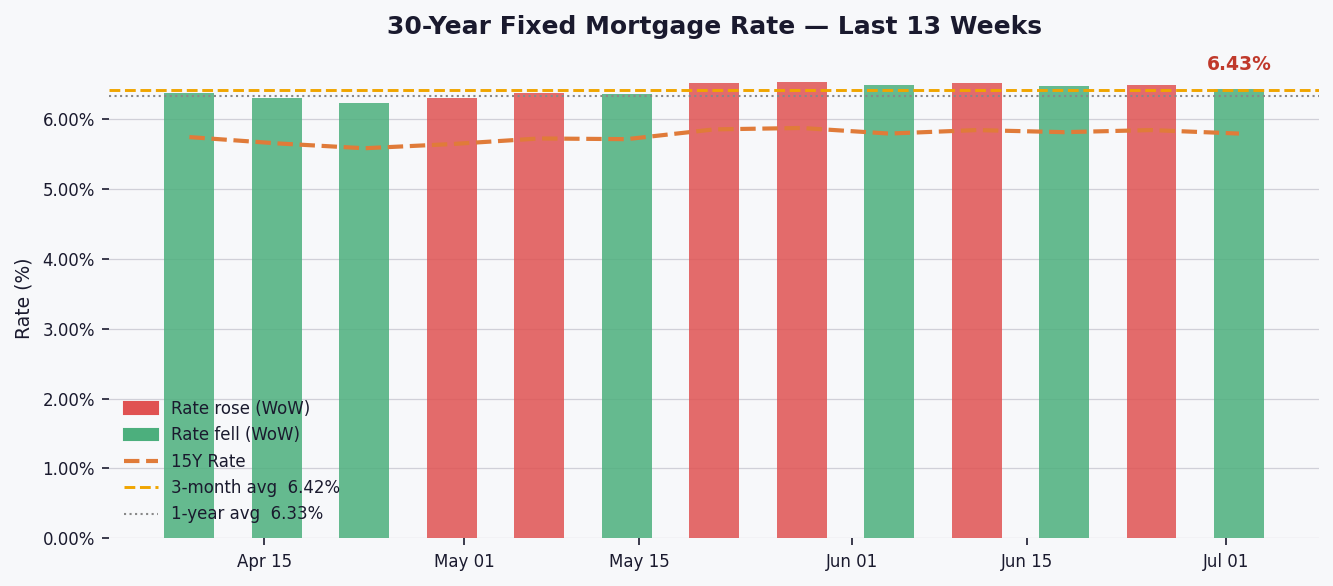
Mortgage rates dip to 6.43%, easing affordability slightly for homebuyers
The 30-year fixed mortgage rate fell 6 basis points this week to 6.43%, offering modest relief to buyers as the $400,000 monthly payment drops to $2,510 from $2,487 a year ago.
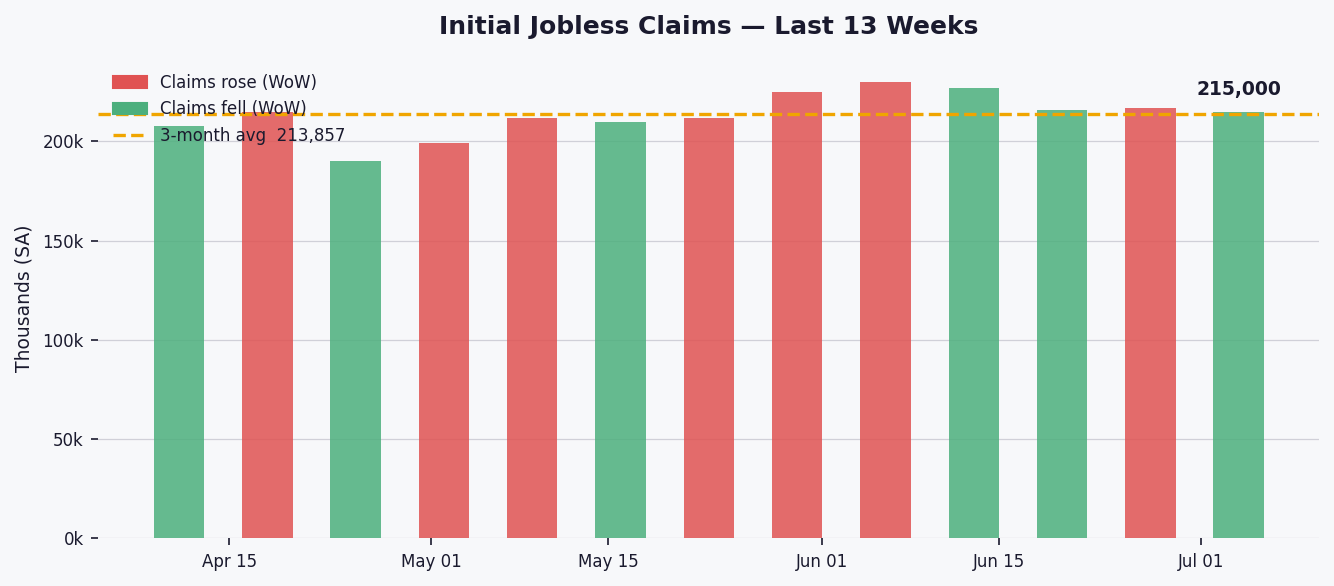
US jobless claims dip slightly to 215,000 as labor market holds steady
Initial jobless claims edged down by 2,000 to 215,000 last week, marking a modest 0.9% decline as the labor market continues to show stability.
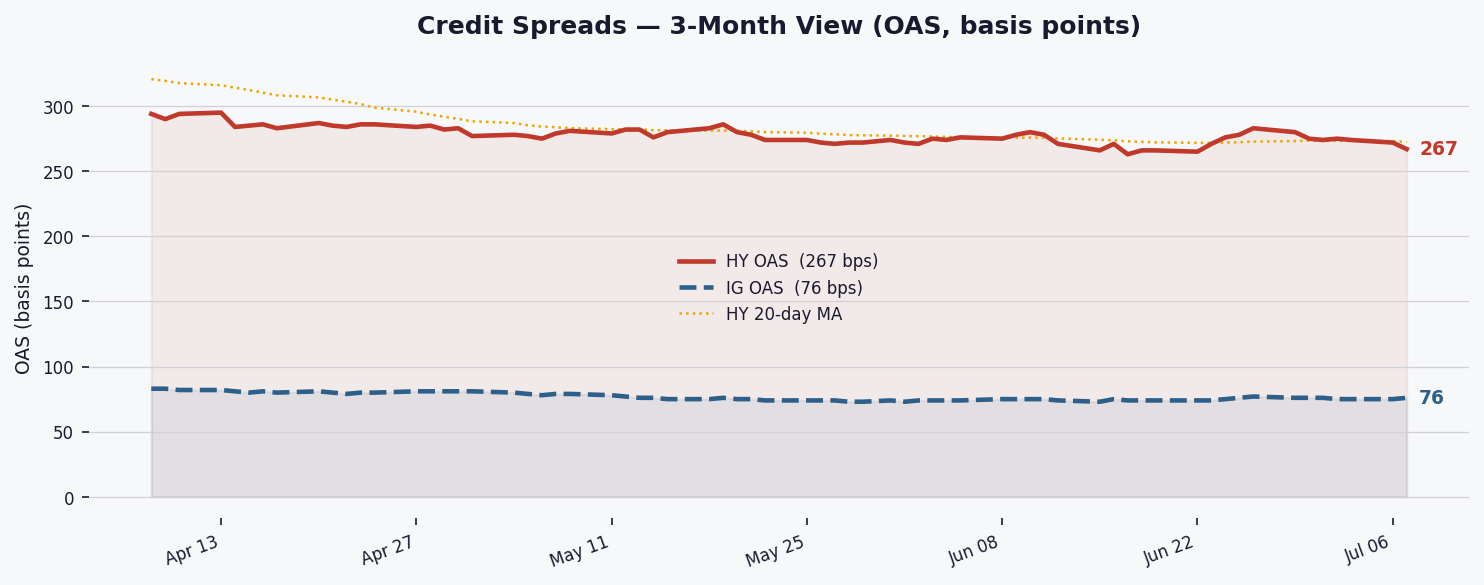
HY spreads tighten to 267bps as risk appetite extends into July
High-yield spreads tightened 5bps to 267bps (5th percentile) in a NORMAL regime, signaling sustained investor comfort with credit risk despite historically tight valuations and potential equity spillover effects.
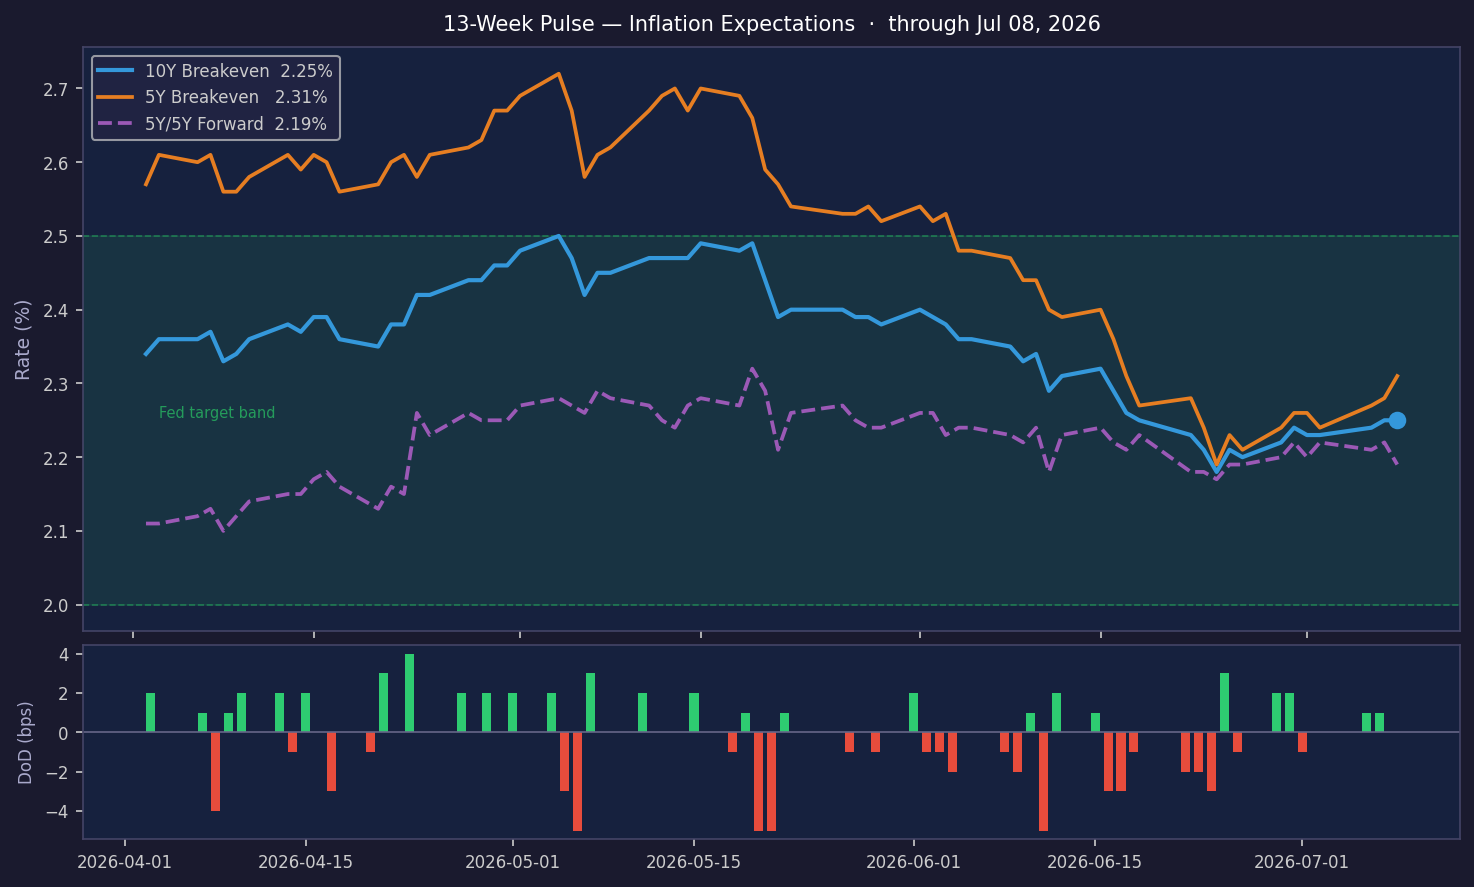
Inflation Expectations Steady at 2.25%, Target Met
The breakeven inflation rate equals the yield gap between a conventional Treasury and a TIPS of the same maturity. If the 10Y nominal yields 4.50% and the 10Y TIPS yields 2.00%, the 10Y breakeven is 2.50% — the level of average CPI at which an investor is indifferent between the
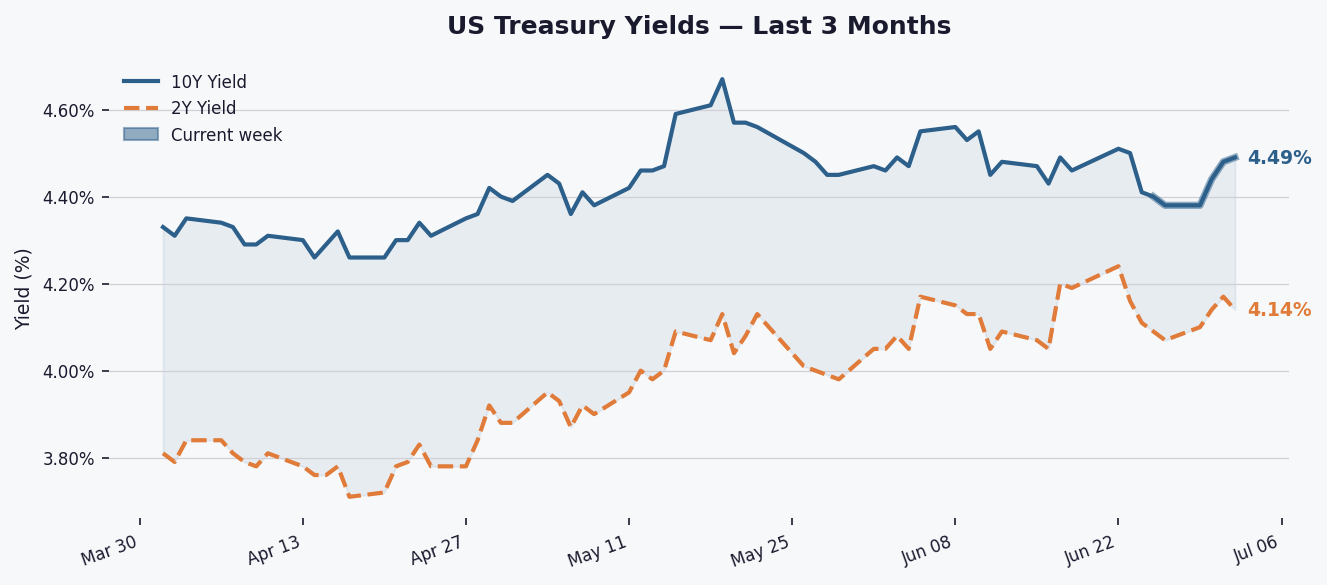
10Y Yield Climbs to 4.49% as Curve Steepens Slightly
The 10-year Treasury yield rose 1 bp to 4.49% Tuesday, extending its weekly gain to 9 bps as the 2Y-10Y spread widened to 35 bps, signaling persistent but modest steepening.
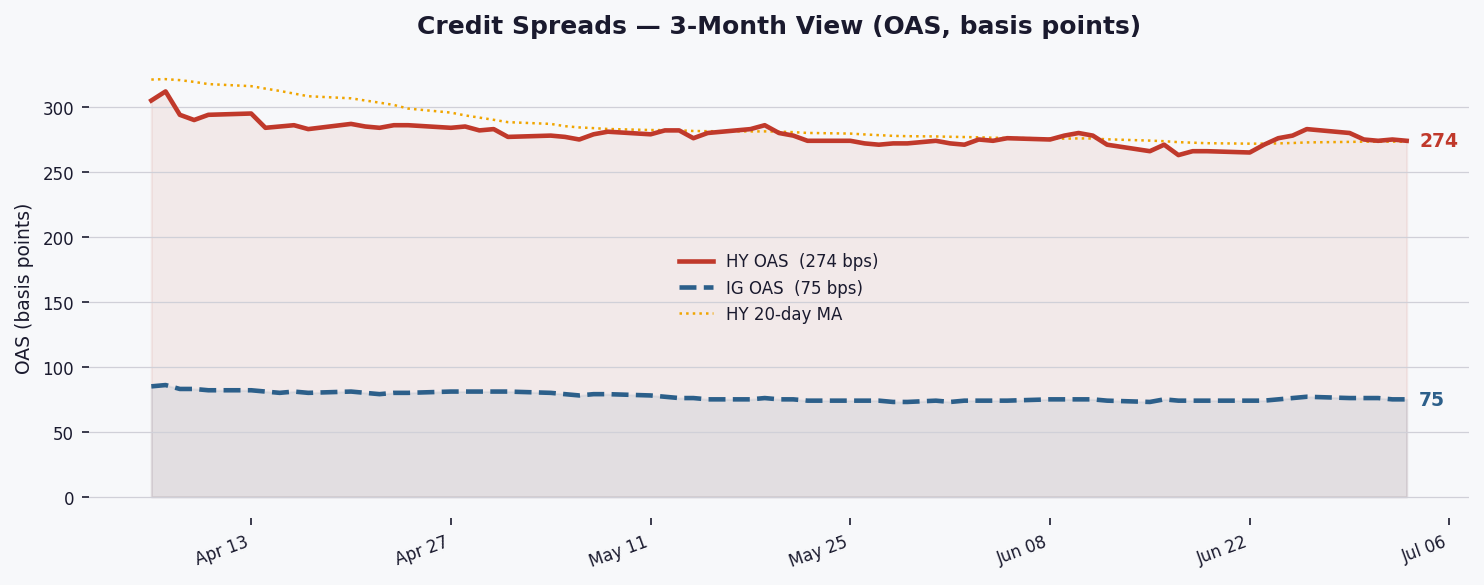
HY spreads tighten to 274 bps as risk appetite holds steady
US high-yield spreads edged 1 bp tighter to 274 bps (11th percentile) in a NORMAL regime, with week-on-week compression of 9 bps signaling persistent demand for yield despite elevated Treasury volatility.
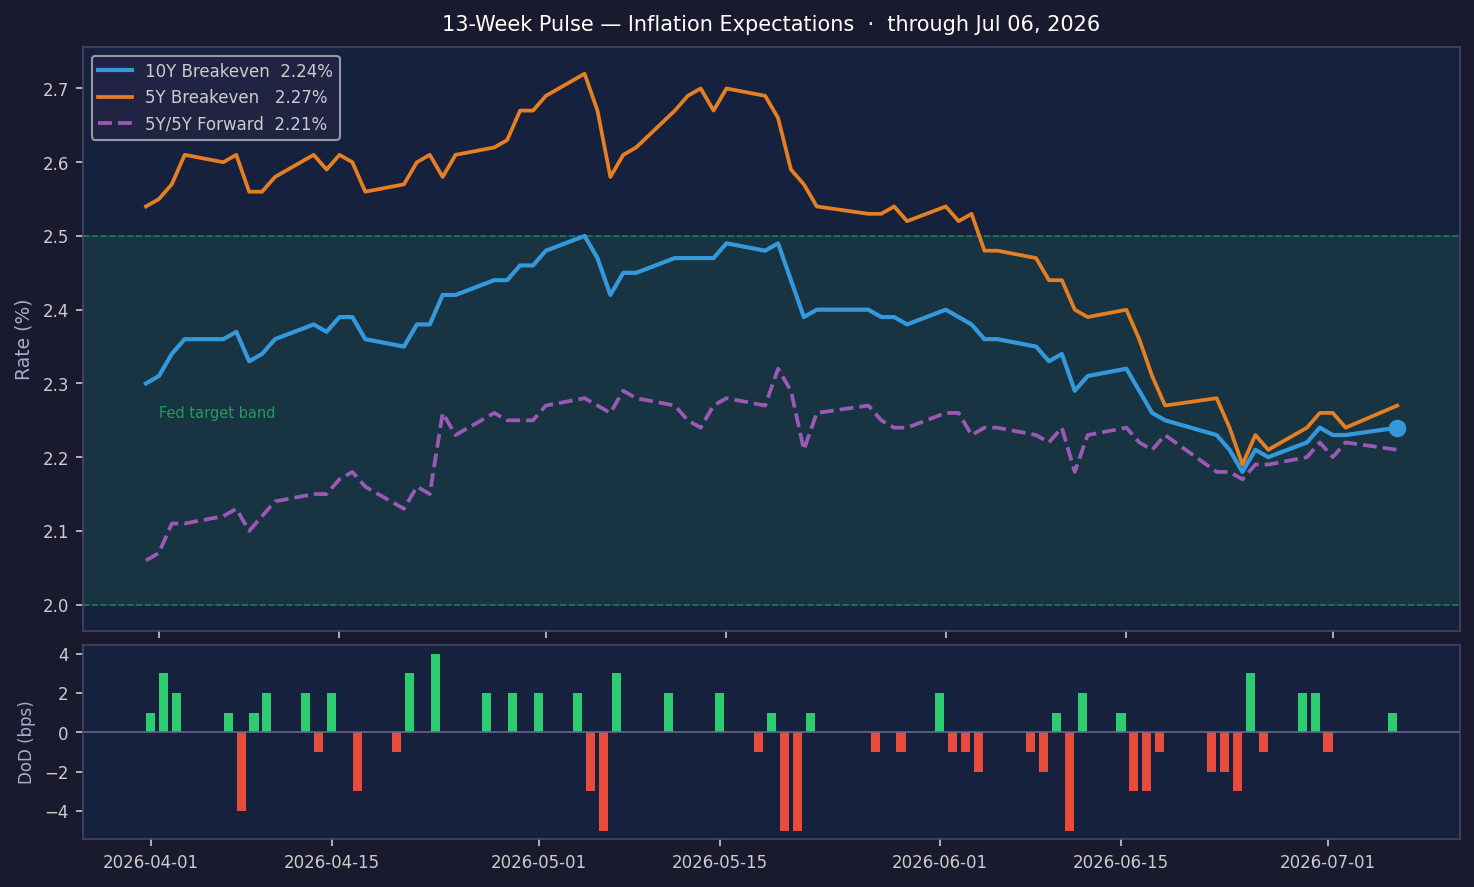
Inflation Expectations Hold Steady at 2.24%, Up 1.0 bps
The breakeven inflation rate equals the yield gap between a conventional Treasury and a TIPS of the same maturity. If the 10Y nominal yields 4.50% and the 10Y TIPS yields 2.00%, the 10Y breakeven is 2.50% — the level of average CPI at which an investor is indifferent between the
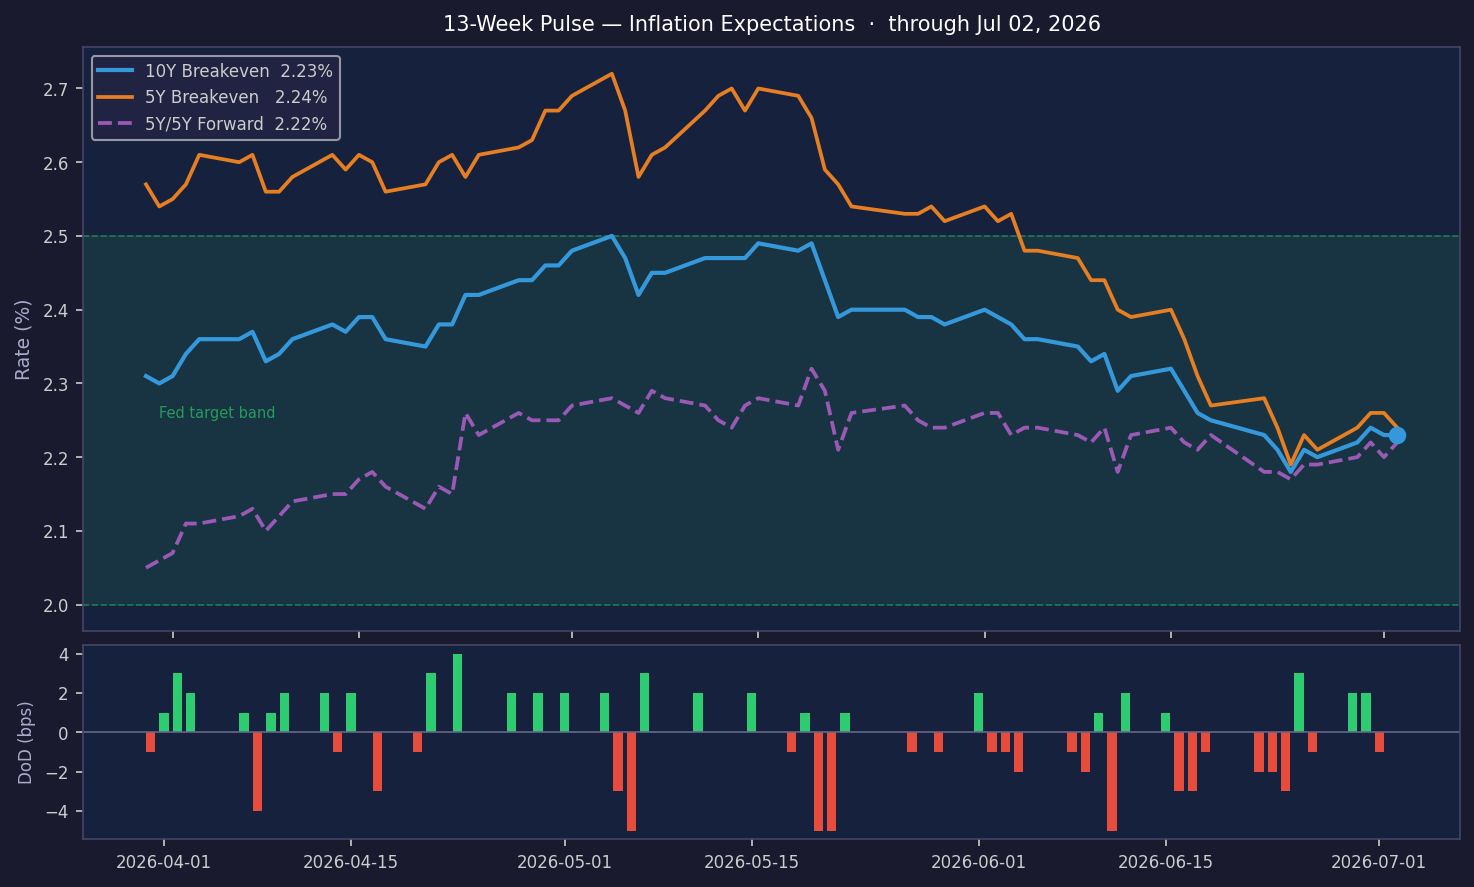
In
The breakeven inflation rate equals the yield gap between a conventional Treasury and a TIPS of the same maturity. If the 10Y nominal yields 4.50% and the 10Y TIPS yields 2.00%, the 10Y breakeven is 2.50% — the level of average CPI at which an investor is indifferent between the
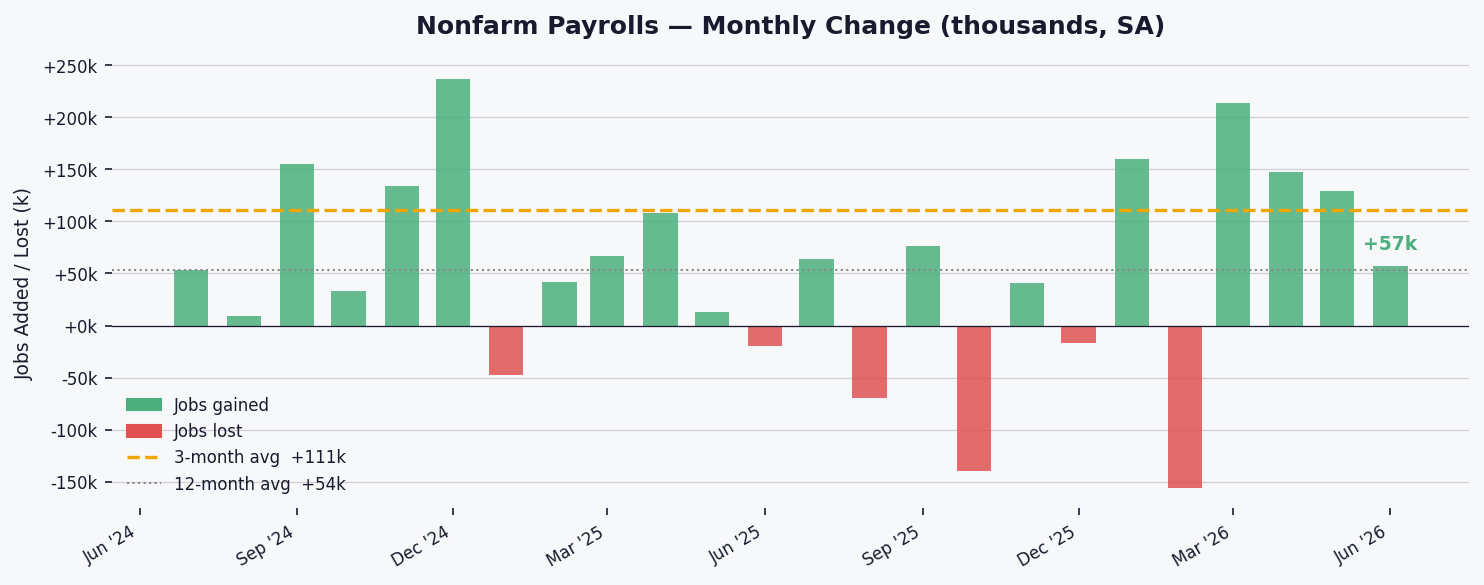
June Jobs Growth Slows to +57k, Unemployment Dips to 4.2% as Labor Market Cools
The U.S. added just 57,000 jobs in June 2026, well below the 3-month average of +111k, as private sector hiring (+49k) and government gains (+8k) signaled a deceleration in labor demand amid tighter monetary conditions.
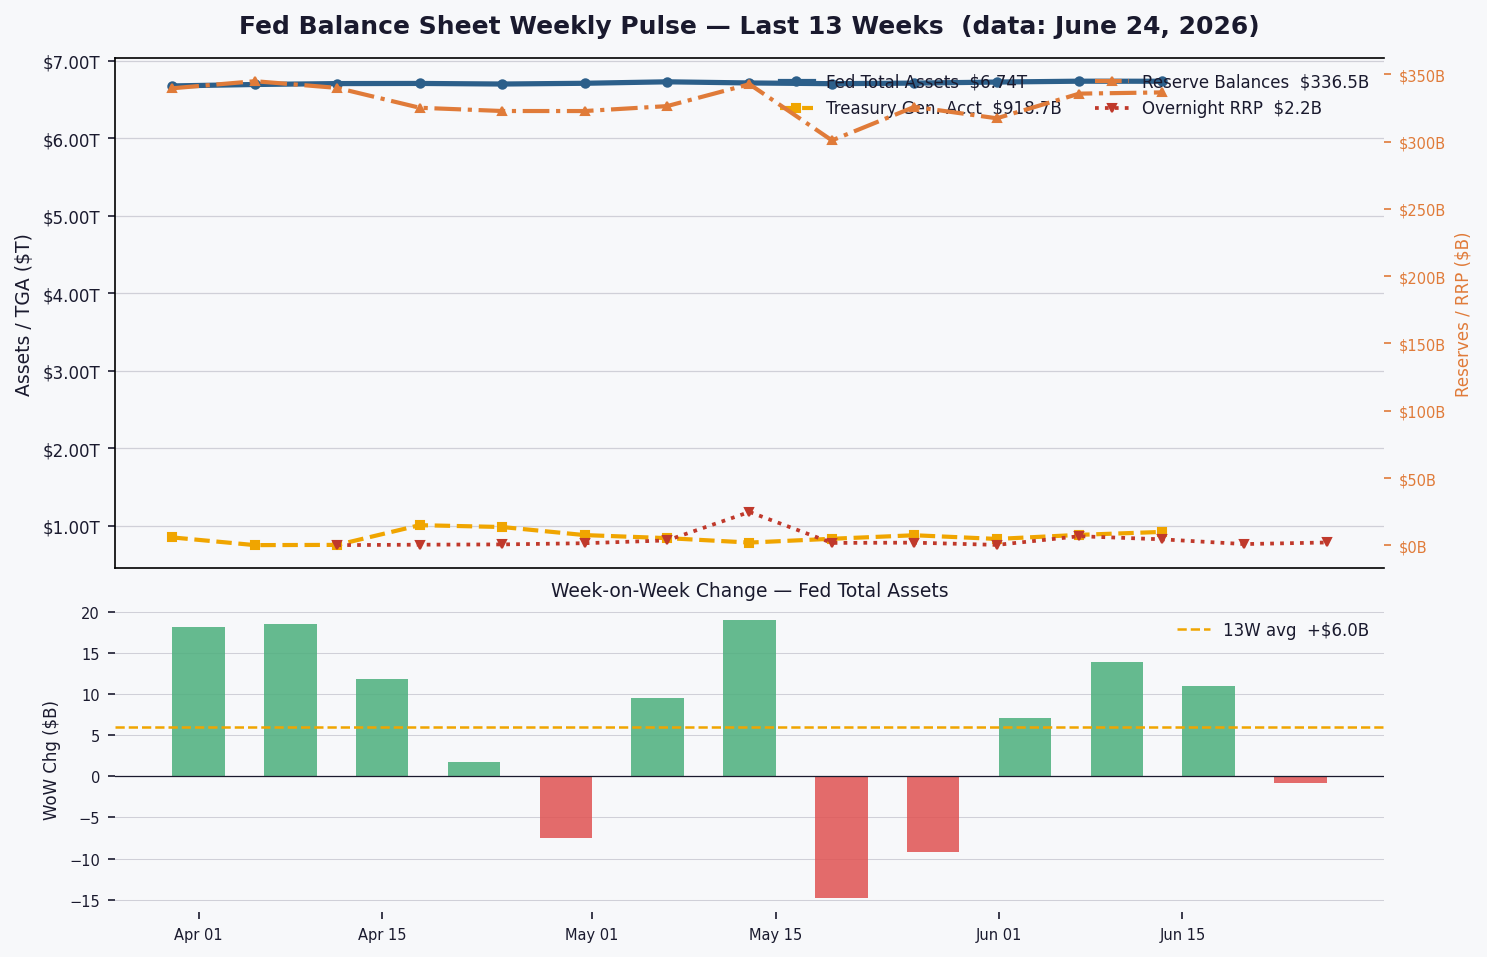
Fed balance sheet shrinks to $6.74T, reserves at critical $336.5B as QT drains liquidity
The Fed's balance sheet stands at $6.74T, down $2.23T (24.9%) from its April 2022 peak, with reserves plunging to $336.5B — a critical level signaling tightening financial conditions as QT persists.
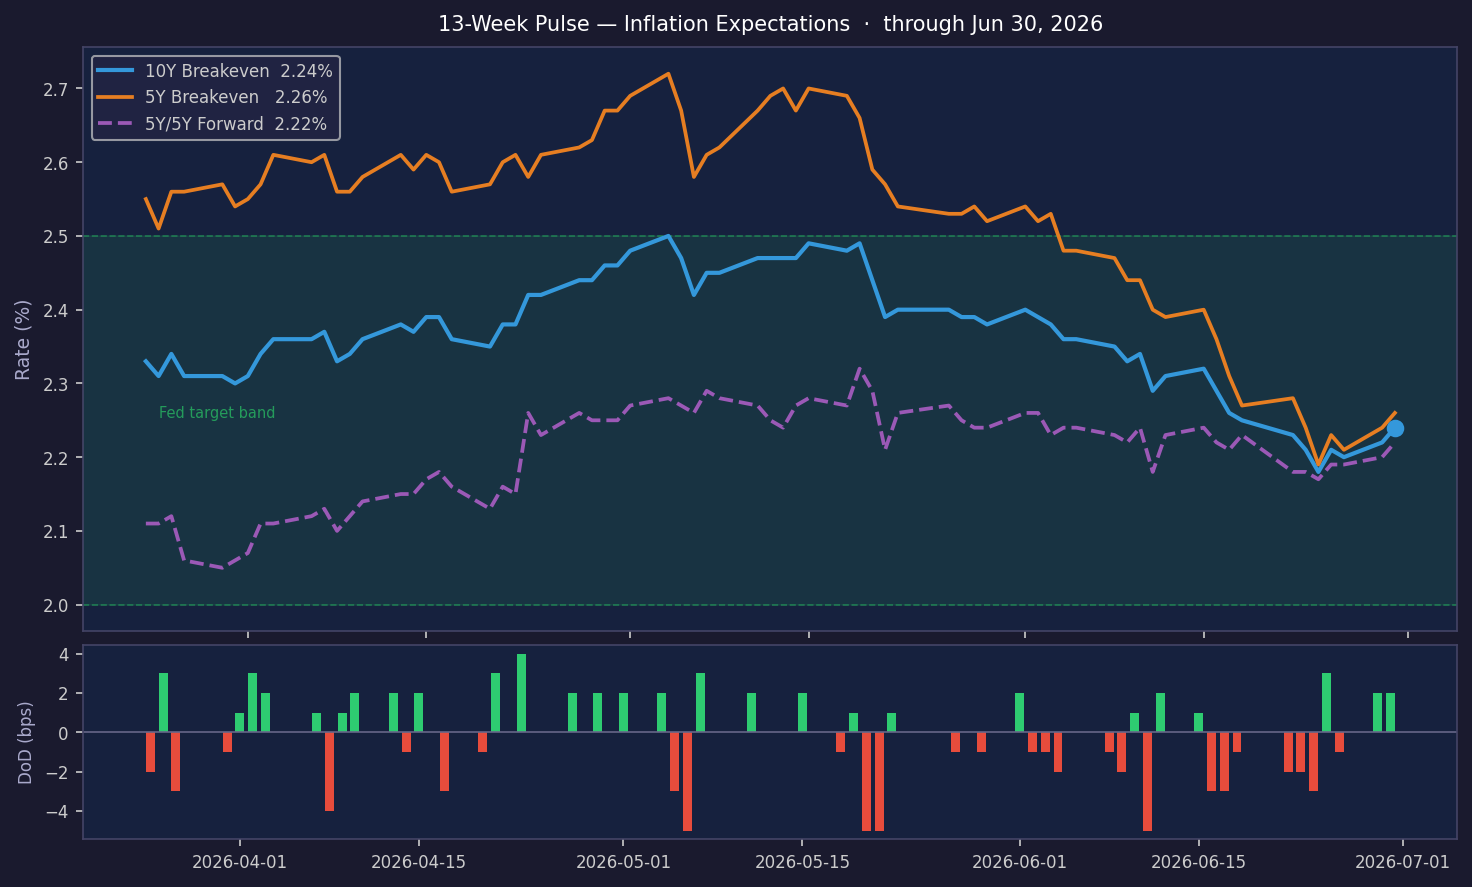
Inflation Expectations Hold Steady at 2.24%, Up 2bps
The breakeven inflation rate equals the yield gap between a conventional Treasury and a TIPS of the same maturity. If the 10Y nominal yields 4.50% and the 10Y TIPS yields 2.00%, the 10Y breakeven is 2.50% — the level of average CPI at which an investor is indifferent between the
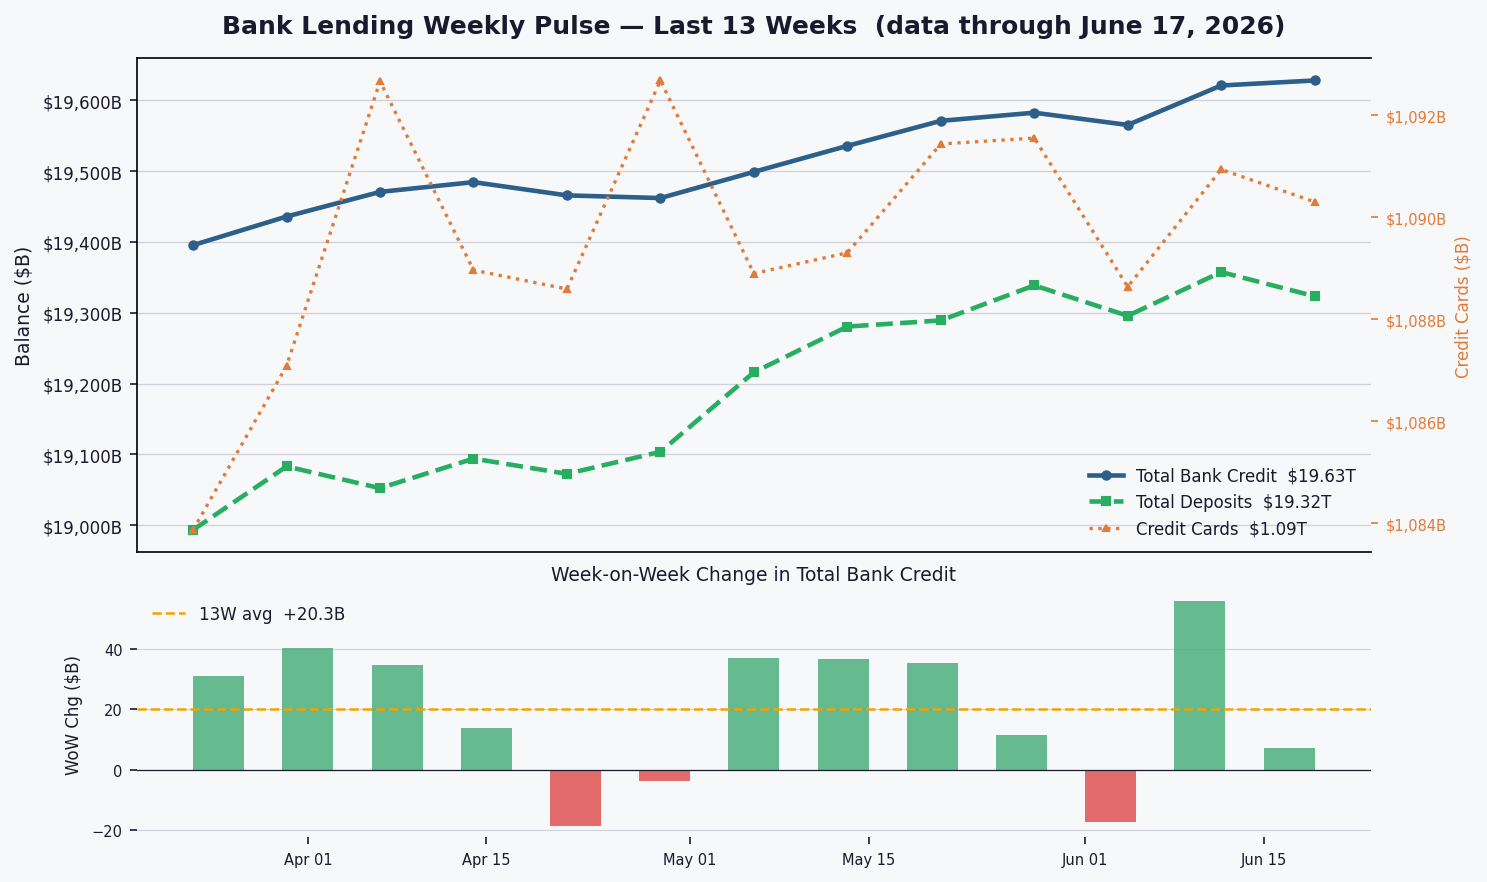
Bank credit growth slows to $7.1B as deposits drop $34.2B; commercial loans lead at +8.1% YoY
Total bank credit edged up $7.1B to $19.63T, decelerating below the 13-week average, while deposits fell $34.2B — pushing the credit/deposit ratio to 101.6%, signaling tighter funding conditions that could constrain future lending amid moderate economic growth.
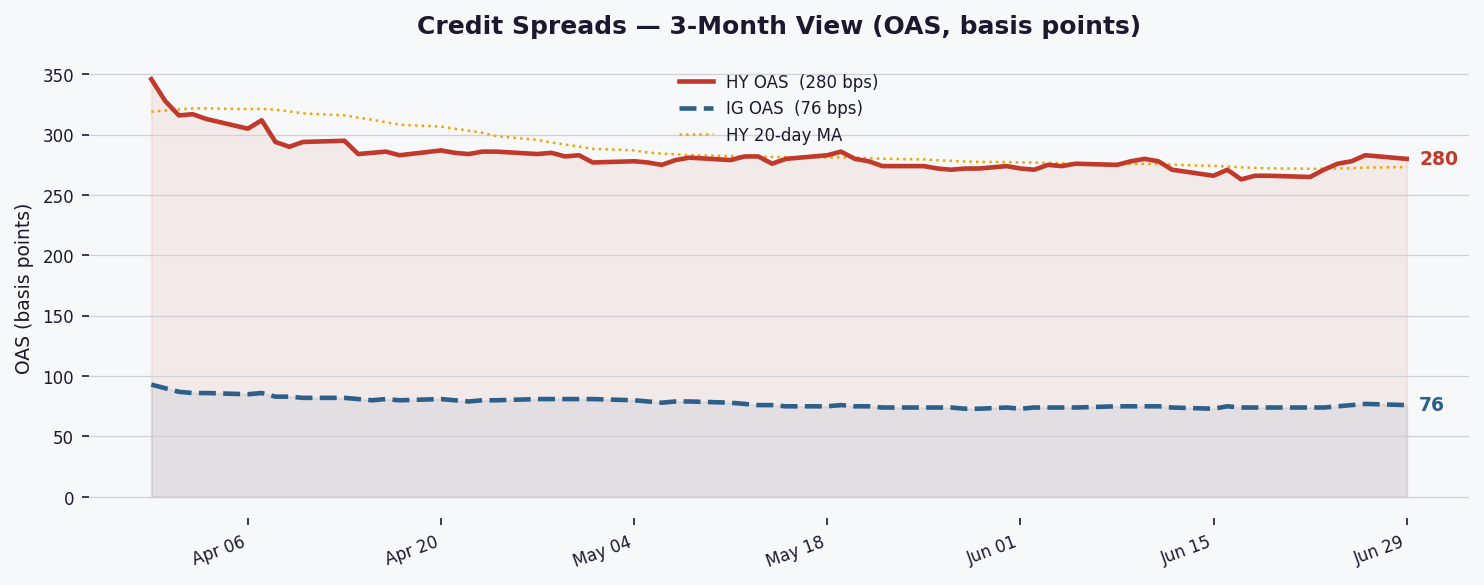
HY spreads tighten to 280 bps as markets shrug off recent widening
US high-yield spreads edged 3 bps tighter to 280 bps in a NORMAL regime, though still 15 bps wider on the week, signaling cautious optimism amid lingering macro uncertainty.
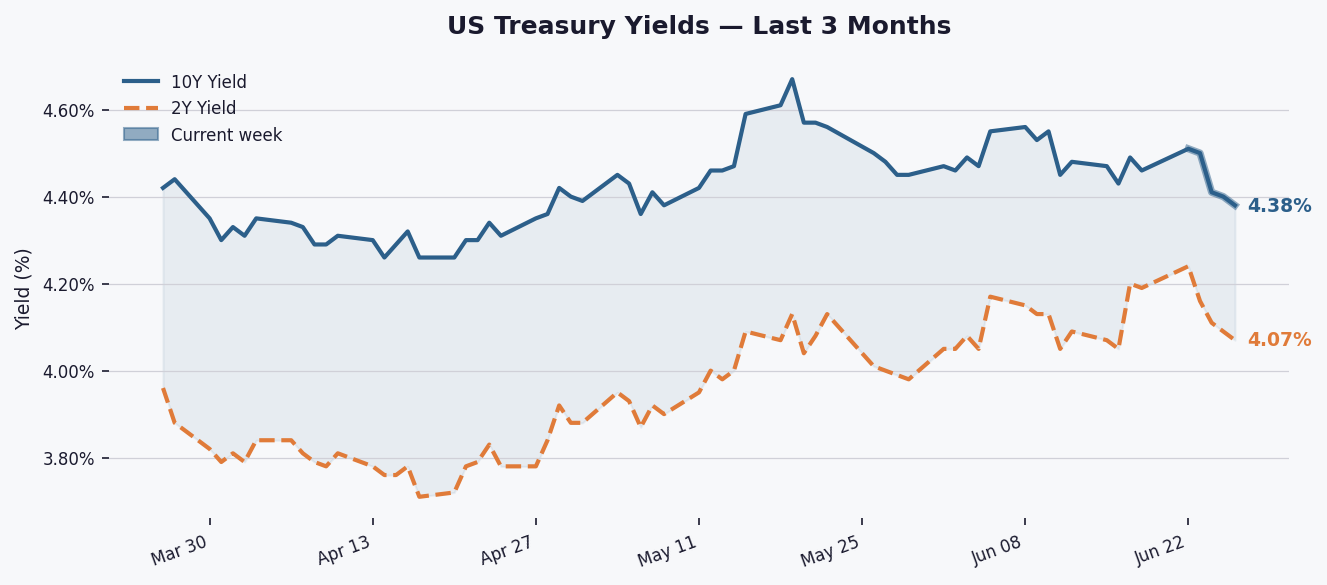
Treasury Yields Edge Lower as Curve Steepens Slightly Amid Fed Watch
The 10-year Treasury yield dipped 2 bps to 4.38%, extending its weekly decline to 8 bps, while the 2Y-10Y spread widened slightly to +28 bps, maintaining a positive curve signal.
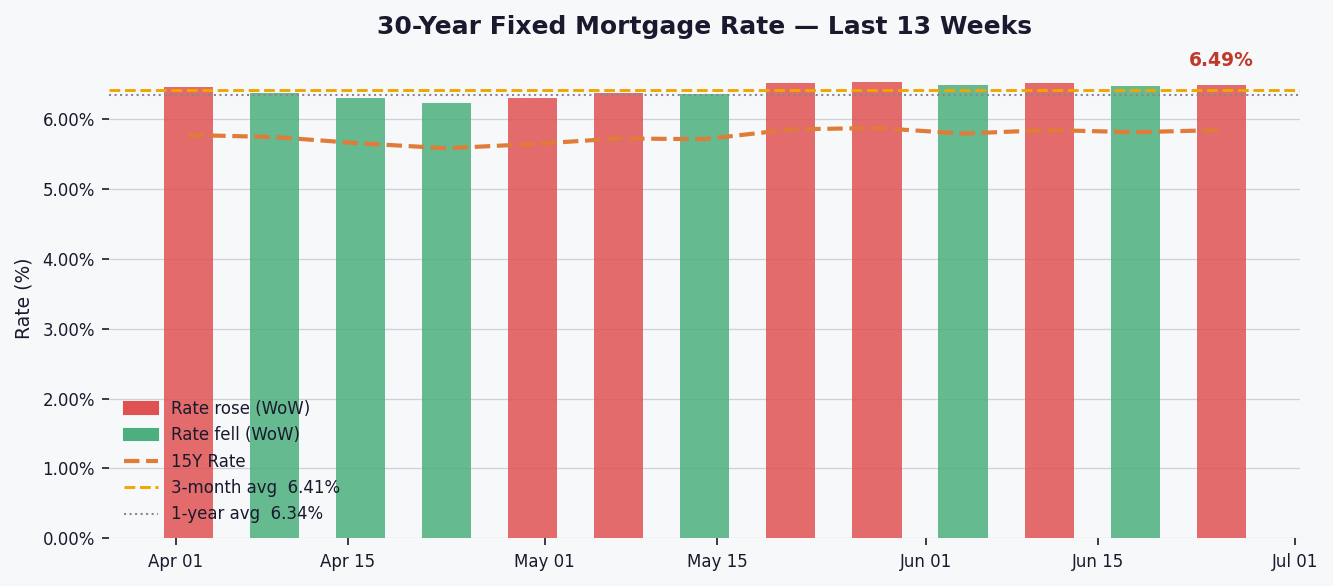
Mortgage Rates Edge Higher — 30-Year at 6.49%, Adding $40 to Monthly Payments vs Last Year
The 30-year fixed mortgage rate rose 2 basis points this week to 6.49%, pushing the monthly payment on a $400,000 loan to $2,526 as persistent inflation keeps upward pressure on borrowing costs.
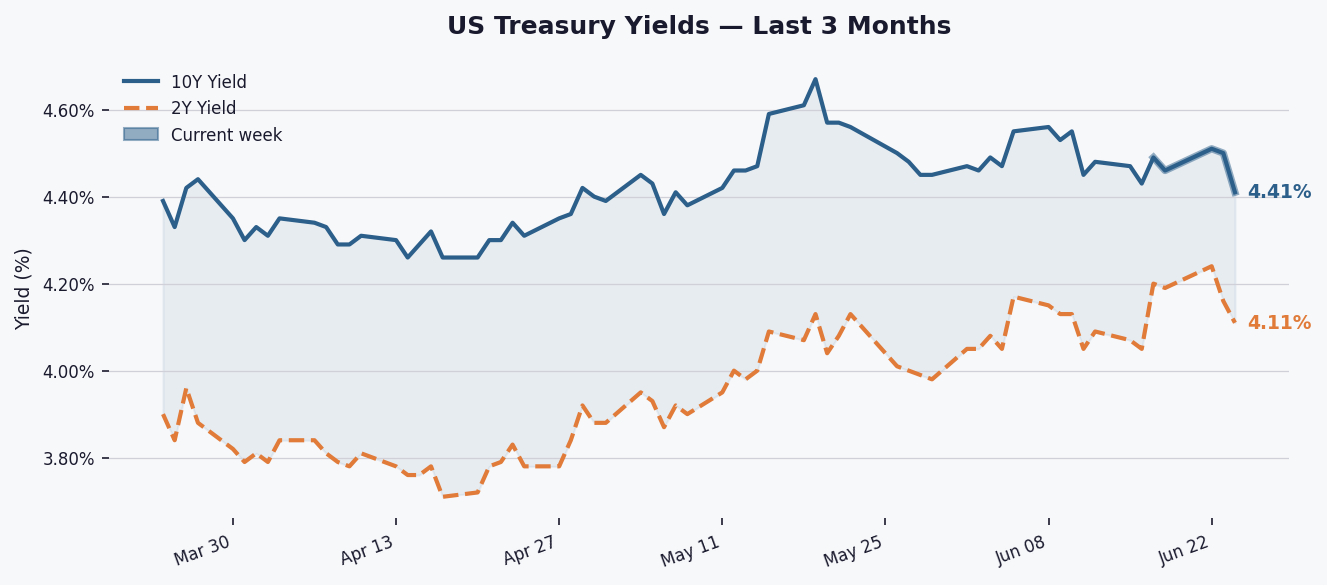
10Y Yield Dips to 4.41% as Curve Steepens Slightly Amid Mixed Data
The 10-year Treasury yield settled at 4.41%, down 2 bps for the week, while the 2Y-10Y spread widened to 31 bps, signaling persistent but modest economic optimism.