S&P 5005,963+0.54%
NASDAQ21,443+0.87%
DOW43,892+0.31%
DAX23,888+0.44%
FTSE 1008,721-0.12%
EUR/USD1.1465+0.07%
GBP/USD1.3220+0.14%
USD/JPY161.31-0.03%
Gold3,241+0.22%
WTI Oil76.40+0.81%
Bitcoin103,241+1.43%
10Y UST4.47%-9bp
S&P 5005,963+0.54%
NASDAQ21,443+0.87%
DOW43,892+0.31%
DAX23,888+0.44%
FTSE 1008,721-0.12%
EUR/USD1.1465+0.07%
GBP/USD1.3220+0.14%
USD/JPY161.31-0.03%
Gold3,241+0.22%
WTI Oil76.40+0.81%
Bitcoin103,241+1.43%
10Y UST4.47%-9bp
MarketsFN
Economics

10Y Yield Climbs to 4.49% as Curve Steepens Slightly

MarketsFN Data Team
4 min read
10Y Yield Climbs to 4.49% as Curve Steepens Slightly
Fixed Income · Treasury Yields · Mid-Week Update

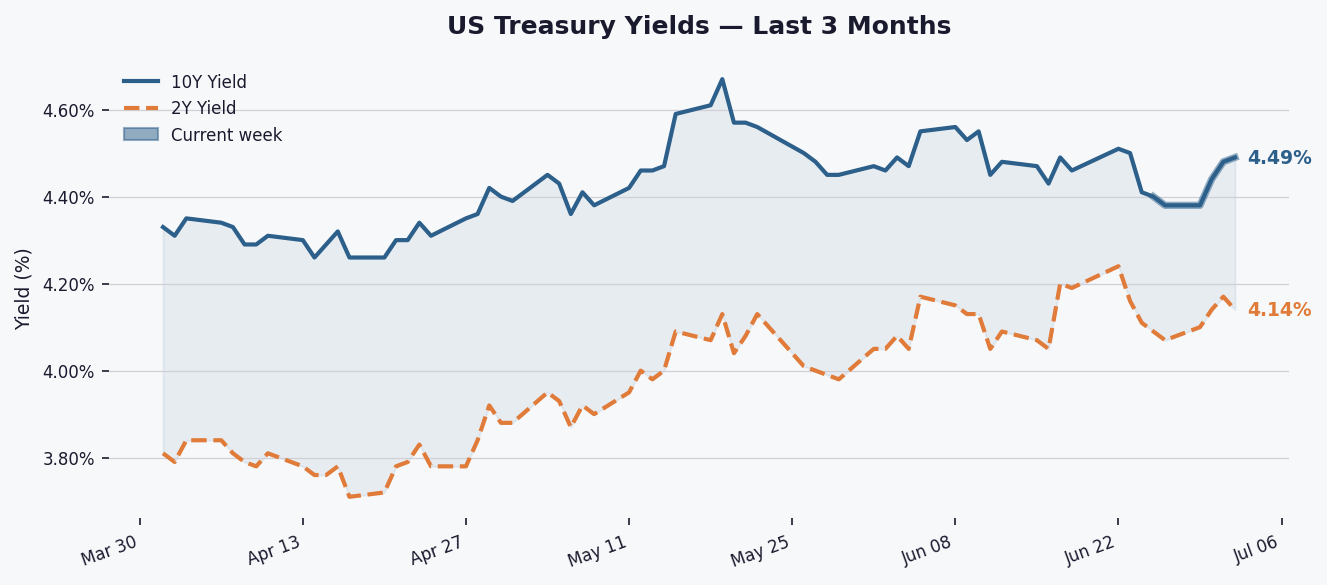
The 10-year Treasury yield rose 1 bp to 4.49% Tuesday, extending its weekly gain to 9 bps as the 2Y-10Y spread widened to 35 bps, signaling persistent but modest steepening.

The 10-year yield has risen 9 bps this week to 4.49%, hovering above its 3-month (4.424%) and 1-year (4.248%) averages. It remains below its 52-week high of 4.67% but is up 30 bps YTD, reflecting a gradual upward drift in longer-term rates amid shifting Fed expectations.

The 2Y-10Y spread widened 4 bps this week to +35 bps, maintaining a positive slope but well below its 52-week high of +74 bps. A non-inverted curve historically signals modest growth expectations, though the narrow spread suggests lingering caution about long-term economic momentum.

36-month yield spread chart
Fig. 2 — 2Y–10Y Treasury spread over 36 months. Green fill = normal curve; red fill = inverted (recession warning signal). Grey shading marks NBER-defined recessions where applicable.

Markets await Friday's jobs report for June, with wage growth and payrolls data likely to sway yields. Fed speakers this week may also clarify rate-cut timing, while global bond moves could amplify domestic Treasury volatility.

Key Statistics at a Glance

EditionMid-Week Update
DateTuesday, July 07, 2026
10Y Yield4.49%
10Y Day-on-day▲ 1.0 bps
10Y Week-on-week▲ 9.0 bps
10Y YTD change+30.0 bps
10Y 3-month avg4.42%
10Y 1-year avg4.25%
10Y 52-week high4.67%
10Y 52-week low3.97%
2Y Yield4.14%
2Y–10Y Spread+0.350% (+35.0 bps)
Spread WoW▲ 4.0 bps
Spread 52-week high+0.740%
Spread 52-week low+0.270%
Curve signalPositive
Data: Federal Reserve Bank of St. Louis (FRED) · Series: DGS10, DGS2, T10Y2Y, USREC · Daily, business days only · Source: US Treasury / Federal Reserve.
#US Treasuries#Bond Market#Yield Curve#Interest Rates#10-Year Treasury#2-Year Treasury#2Y10Y Spread#Federal Reserve#Fixed Income#FRED

Related Articles

Mortgage Rates Edge Up to 6.58%, Pushing Monthly Payments $65 Higher Than Last Year
Economics

Mortgage Rates Edge Up to 6.58%, Pushing Monthly Payments $65 Higher Than Last Year

MarketsFN Data Team
4 minJul 30, 2026
US jobless claims rise to 197,000 but remain near historic lows
Economics

US jobless claims rise to 197,000 but remain near historic lows

MarketsFN Data Team
4 minJul 30, 2026
Inflation Expectations Hit 2.26%, Up 6bps—On Target
Economics

Inflation Expectations Hit 2.26%, Up 6bps—On Target

MarketsFN Data Team
4 minJul 30, 2026