10Y Yields Rise 12 Bps to 4.56% as Curve Steepens Further
MarketsFN Data Team
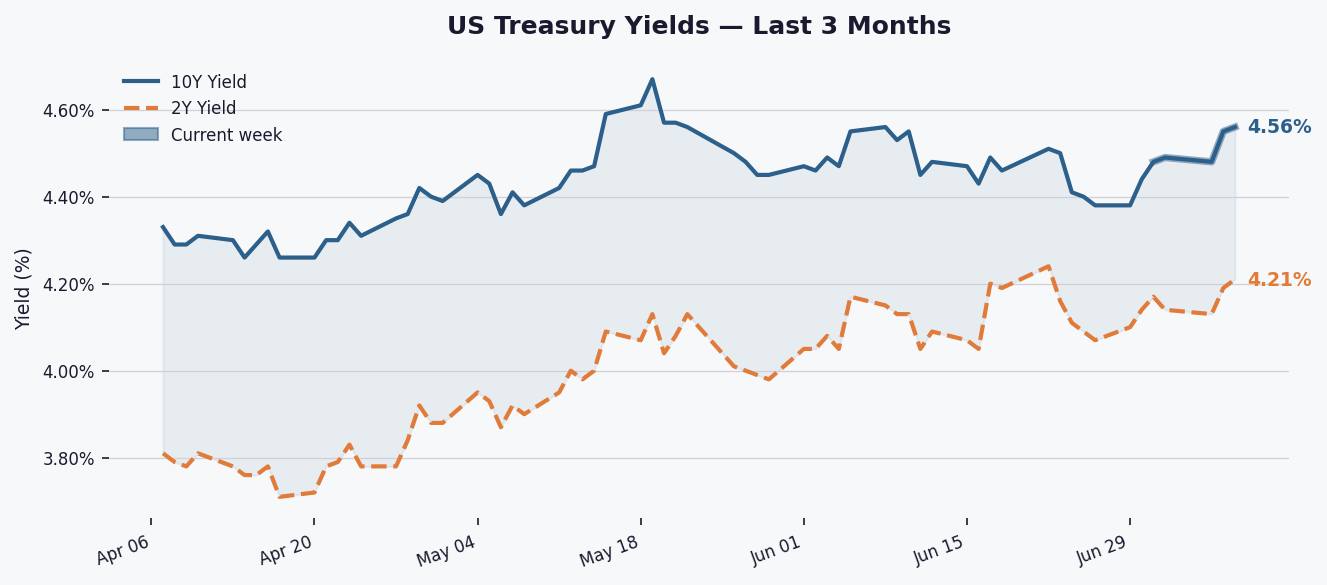
The 10-year Treasury yield climbed 12 basis points this week to settle at 4.56%, extending its 2026 uptrend while the 2Y-10Y spread widened to +38 bps, reinforcing a positive curve signal.
The 10-year yield rose 12 bps this week to 4.56%, marking its highest weekly close since early June. It now sits 12.5 bps above its 3-month average and 31 bps above its 1-year average, remaining just 11 bps shy of its 52-week high of 4.67% hit in April 2026.
The 2Y-10Y spread widened 7 bps this week to +38 bps, its steepest level since February, as longer-dated yields outpaced short-term moves. The persistently positive curve suggests markets anticipate neither near-term Fed cuts nor immediate recession risks, contrasting with last year's inversion fears.

Traders will scrutinize June CPI data and Fed Chair Powell's congressional testimony next week for clues on inflation persistence, with yields sensitive to any shift in rate-cut expectations ahead of the July FOMC meeting.
Key Statistics at a Glance
| Edition | Weekly Close |
| Date | Friday, July 10, 2026 |
| 10Y Yield | 4.56% |
| 10Y Day-on-day | ▲ 1.0 bps |
| 10Y Week-on-week | ▲ 12.0 bps |
| 10Y YTD change | +37.0 bps |
| 10Y 3-month avg | 4.43% |
| 10Y 1-year avg | 4.25% |
| 10Y 52-week high | 4.67% |
| 10Y 52-week low | 3.97% |
| 2Y Yield | 4.21% |
| 2Y–10Y Spread | +0.380% (+38.0 bps) |
| Spread WoW | ▲ 7.0 bps |
| Spread 52-week high | +0.740% |
| Spread 52-week low | +0.270% |
| Curve signal | Positive |