S&P 5005,963+0.54%
NASDAQ21,443+0.87%
DOW43,892+0.31%
DAX23,888+0.44%
FTSE 1008,721-0.12%
EUR/USD1.1465+0.07%
GBP/USD1.3220+0.14%
USD/JPY161.31-0.03%
Gold3,241+0.22%
WTI Oil76.40+0.81%
Bitcoin103,241+1.43%
10Y UST4.47%-9bp
S&P 5005,963+0.54%
NASDAQ21,443+0.87%
DOW43,892+0.31%
DAX23,888+0.44%
FTSE 1008,721-0.12%
EUR/USD1.1465+0.07%
GBP/USD1.3220+0.14%
USD/JPY161.31-0.03%
Gold3,241+0.22%
WTI Oil76.40+0.81%
Bitcoin103,241+1.43%
10Y UST4.47%-9bp
MarketsFN
Economics

Mortgage rates climb to 6.49%, adding $41 to monthly payments on a $400k loan

MarketsFN Data Team
4 min read
Mortgage rates climb to 6.49%, adding $41 to monthly payments on a $400k loan
Housing · Mortgage Rates · Weekly Tracker
6.49%
30-Year Fixed Mortgage Rate
▲ 6.0 bps week-on-week  ·  $2,526/mo on a $400,000 loan

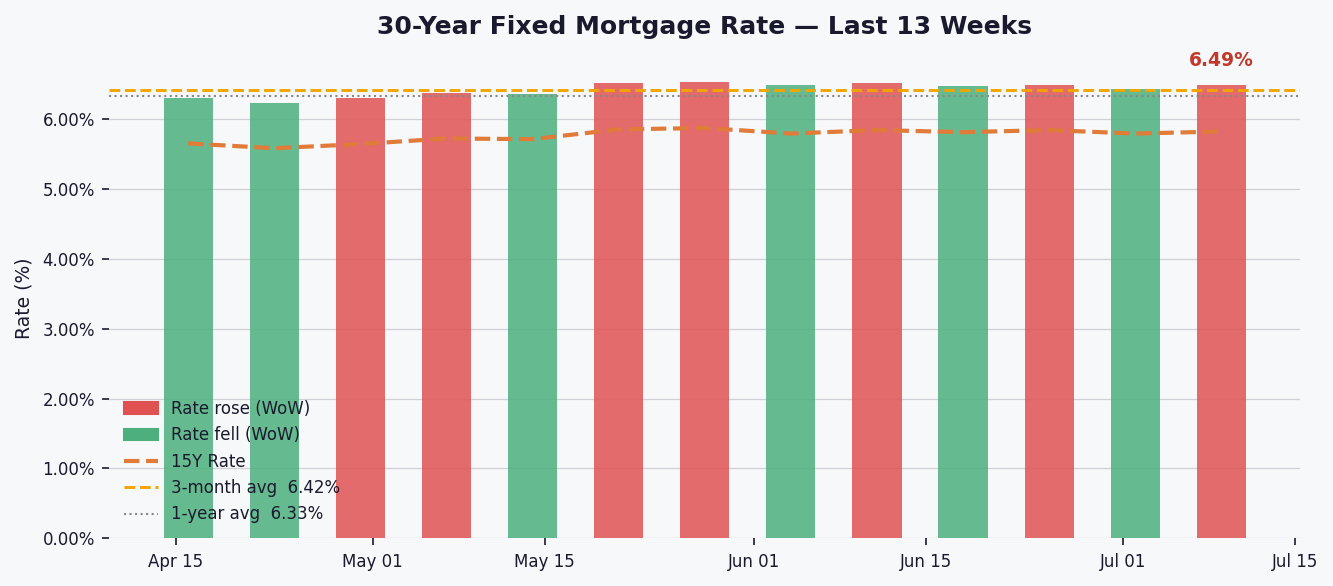
The 30-year fixed mortgage rate rose 6 basis points this week to 6.49%, pushing the monthly payment on a $400,000 loan to $2,526 — $41 higher than a year ago as borrowing costs continue their upward trend.

At 6.49%, today's rate sits above the 3-month (6.42%) and 1-year averages (6.33%), and well above the 5-year norm of 6.03%. Rates remain below the 52-week high of 6.75% but have climbed significantly from last year's low of 5.98%. The $2,526 monthly payment on a $400k loan now costs borrowers $492 more annually than at last July's rates.

Mortgage rates are being pushed higher by the 10-year Treasury yield's rise to 4.58%, coupled with a stubbornly wide mortgage-Treasury spread of 1.91 percentage points. This reflects lenders' continued caution despite the Fed holding rates steady at 3.63%, suggesting persistent inflation concerns in the housing finance market.

36-month trend chart
Fig. 2 — 30Y mortgage (red), 15Y mortgage (orange), Fed Funds Rate (dark blue), 10Y Treasury (light blue) over 36 months. Bottom panel: mortgage–Treasury spread — a wide spread signals elevated lender risk premium.

Next week, watch for Fed commentary on inflation and Friday's PCE price index — the central bank's preferred inflation gauge. Stronger-than-expected data could push rates toward the 52-week high, while softer numbers may offer relief to prospective buyers.

Key Statistics at a Glance

Week endingJuly 16, 2026
30Y Fixed Rate6.49%
WoW change▲ 6.0 bps
YTD change+33.0 bps
15Y Fixed Rate5.82%
15Y WoW▲ 3.0 bps
3-month average6.42%
1-year average6.33%
5-year average6.03%
52-week high6.75%
52-week low5.98%
Fed Funds Rate3.63%
10Y Treasury4.58%
Mortgage–10Y Spread1.91 pp
Monthly pmt $400k/30Y$2,526
vs 1 year ago▲ $40/month
Data: Federal Reserve Bank of St. Louis (FRED) · Series: MORTGAGE30US, MORTGAGE15US, FEDFUNDS, DGS10 · 30Y & 15Y rates: Freddie Mac Primary Mortgage Market Survey, released every Thursday.
#Mortgage Rates#30-Year Fixed Rate#15-Year Fixed Rate#Housing Market#Freddie Mac#Real Estate#Federal Reserve#10-Year Treasury#FRED#Home Buying#Interest Rates

Related Articles

Mortgage Rates Edge Up to 6.58%, Pushing Monthly Payments $65 Higher Than Last Year
Economics

Mortgage Rates Edge Up to 6.58%, Pushing Monthly Payments $65 Higher Than Last Year

MarketsFN Data Team
4 minJul 30, 2026
US jobless claims rise to 197,000 but remain near historic lows
Economics

US jobless claims rise to 197,000 but remain near historic lows

MarketsFN Data Team
4 minJul 30, 2026
Inflation Expectations Hit 2.26%, Up 6bps—On Target
Economics

Inflation Expectations Hit 2.26%, Up 6bps—On Target

MarketsFN Data Team
4 minJul 30, 2026