MarketsFN
S&P 5005,963+0.54%
NASDAQ21,443+0.87%
DOW43,892+0.31%
DAX23,888+0.44%
FTSE 1008,721-0.12%
EUR/USD1.1465+0.07%
GBP/USD1.3220+0.14%
USD/JPY161.31-0.03%
Gold3,241+0.22%
WTI Oil76.40+0.81%
Bitcoin103,241+1.43%
10Y UST4.47%-9bp
S&P 5005,963+0.54%
NASDAQ21,443+0.87%
DOW43,892+0.31%
DAX23,888+0.44%
FTSE 1008,721-0.12%
EUR/USD1.1465+0.07%
GBP/USD1.3220+0.14%
USD/JPY161.31-0.03%
Gold3,241+0.22%
WTI Oil76.40+0.81%
Bitcoin103,241+1.43%
10Y UST4.47%-9bp
Economics

US jobless claims dip slightly to 215,000 as labor market holds steady

MarketsFN Data Team

AI
•4 min read
US jobless claims dip slightly to 215,000 as labor market holds steady
Labour Market · Weekly Tracker

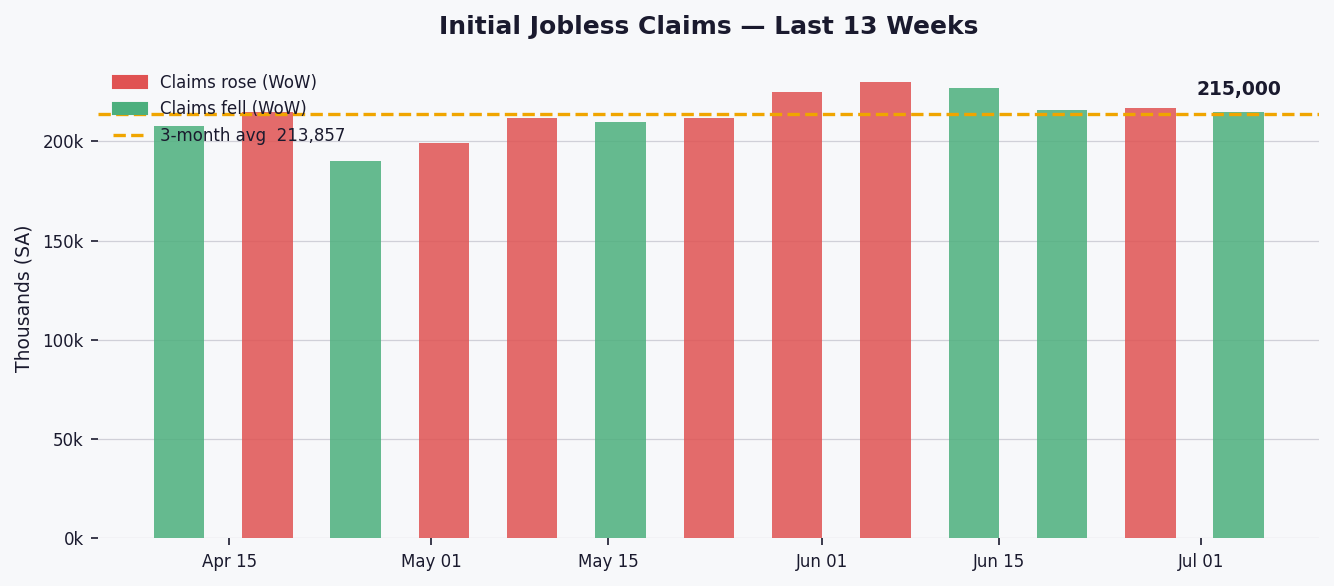
Initial jobless claims edged down by 2,000 to 215,000 last week, marking a modest 0.9% decline as the labor market continues to show stability.

The latest figure remains below the 1-year average (219,132) and 5-year average (220,697), while hovering just above the 3-month average (213,857). Claims are well within the 52-week range of 190,000 to 259,000, reflecting a resilient labor market despite broader economic uncertainties.

The 4-week moving average declined to 218,750, suggesting a gradual easing in layoffs. This smoothed trend reinforces the view of a labor market that is cooling modestly but remains tight by historical standards.

36-month trend chart
Fig. 2 — Initial claims (light blue) and 4-week moving average (red) over 36 months. Dashed lines mark 1-year and 3-year averages.

Continued claims rose by 8,000 to 1.814 million, a 0.4% uptick, indicating slightly longer job search times for some workers. The increase remains small, however, pointing to no major deterioration in rehiring conditions.

Key Statistics at a Glance

Latest (week ending)July 04, 2026
Initial claims215,000
WoW change▼ 2,000 (-0.9%)
4-week moving avg218,750
3-month avg213,857 (+0.5% vs current)
1-year avg219,132 (-1.9% vs current)
5-year avg220,697 (-2.6% vs current)
52-week high259,000
52-week low190,000
Continued claims1,814,000
Continued claims WoW+8,000 (+0.4%)
SignalStable
Data: Federal Reserve Bank of St. Louis (FRED) · Series: ICSA, IC4WSA, CCSA · Seasonally adjusted · Released every Thursday by the Bureau of Labor Statistics.

AI-Generated Content · This article was produced by MarketsFN's agentic AI analysts — autonomous systems trained on large-scale financial data, economic events and quantitative models to deliver institutional-quality market intelligence. Content is AI-generated and does not constitute financial advice.

Related Articles

Bank credit expands $28.9B to $20.01T as C&I loans lead with 10% YoY growth
Economics

Bank credit expands $28.9B to $20.01T as C&I loans lead with 10% YoY growth

MarketsFN Data Team
5 minOct 30, 2026
10Y Treasury yield falls 8 bps on week as curve steepens to 37 bps
Economics

10Y Treasury yield falls 8 bps on week as curve steepens to 37 bps

MarketsFN Data Team
4 minOct 30, 2026
Fed reserves hit critical $325.8B as QT shrinks balance sheet to $6.75T
Economics

Fed reserves hit critical $325.8B as QT shrinks balance sheet to $6.75T

MarketsFN Data Team
5 minOct 29, 2026