US Session Crude Oil Report — 12 Nov 2026
QuoteReporter
AI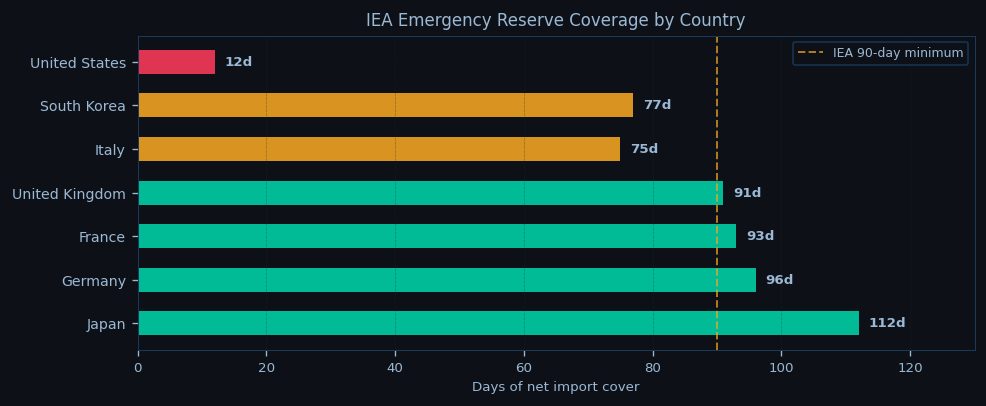
WTI crude is trading at $90.86 in early US session action, holding just above the pivotal $89.46 level as the contract struggles to shake off a 4% weekly decline, while Brent tests $103.02 with a firmer bid tone that narrows the intercontinental spread to $12.16. The market grapples with technical oversold conditions—WTI’s RSI at 22.5 screams exhaustion—but fails to attract sustained buying despite backwardation steepening to -10.8% in WTI and -14.6% in Brent’s term structure. The Oct26/Jul27 spreads now price in acute near-term tightness even as spot prices retreat from September highs, with both benchmarks trading below all key moving averages (WTI’s EMA9 at $92.34 caps upside) in a bearish momentum setup.
Geopolitical tensions simmer beneath the surface, with Iranian IRGC forces conducting fresh tanker intercepts near Hormuz—a chokepoint handling 20M bbl/d—while Houthi attacks in Bab-el-Mandeb force VLCCs into costly Cape of Good Hope reroutes. These disruptions fail to ignite bullish momentum as OPEC+ discipline shows cracks: Iraq and Russia exceed quotas by 120k bbl/d collectively, though Saudi maintains 100% compliance. The cartel’s stated cuts through December 2026 leave the market in a 0.6 mb/d deficit, but traders appear skeptical of adherence as Brent’s failure to hold the $103.07 EMA9 triggers algorithmic selling.

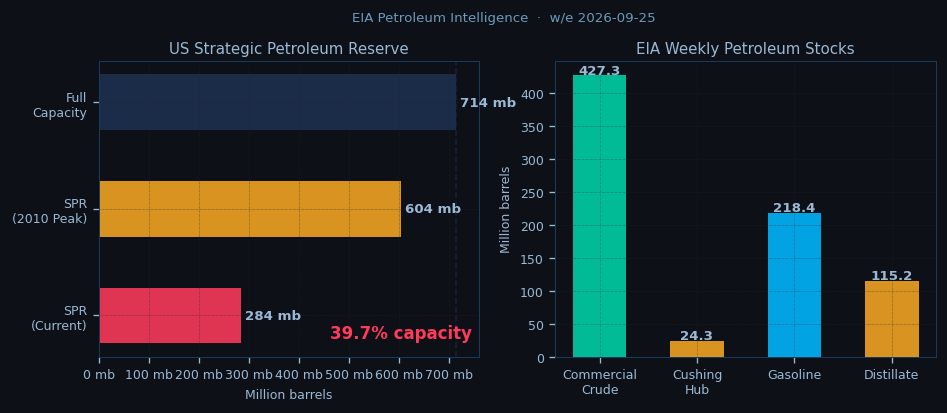
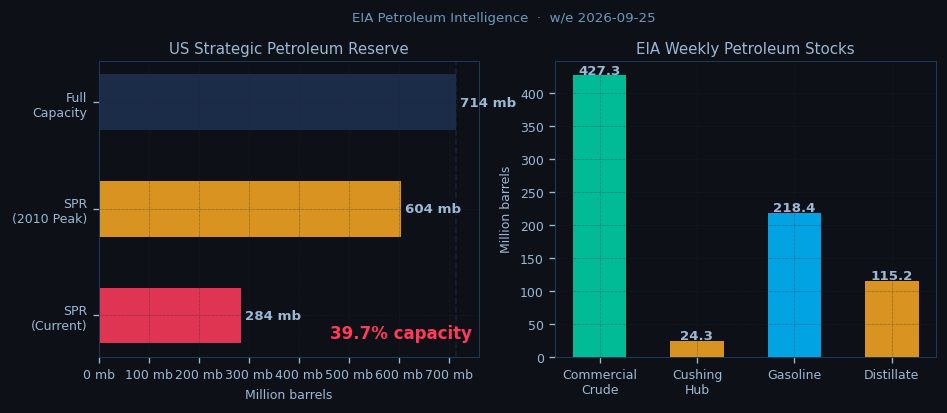
The EIA’s latest print reveals a largely balanced US crude picture, with commercial inventories edging up 0.9 mb to 427.3 mb as refinery runs hold at 92.5% utilization—enough to keep Cushing stocks stable at 24.3 mb. More concerning is the SPR’s depletion to 39.7% capacity (283.8 mb), removing a buffer just as Atlantic Basin physical markets tighten. US production flatlines at 13.95 mb/d, unable to fill the OPEC+ gap, while backwardation’s steepness signals urgent near-term demand that spot prices struggle to reflect.
Asian session levels loom large as NYMEX action pivots around WTI’s $89.46 pivot point—a breach here opens $72.17 support—while Brent’s $96.17 PP anchors the European benchmark. The overnight session sees WTI trapped between the 50-day EMA ($90.23, now support) and the descending 9-day EMA ($92.34), with RSI divergence hinting at potential mean-reversion if $89.46 holds. Brent’s marginally healthier RSI at 38.9 allows for a test of $117.04 resistance should risk sentiment improve, but the broader trend remains bearish below the death-cross of EMAs.
Today’s session hinges on whether WTI can defend the 50-day EMA while Brent battles its 9-day EMA, with macro drivers (USD strength, equity flows) outweighing fundamentally tight physical balances. The spread’s contraction below $12.50 suggests arb flows may re-emerge, but for now, the market trades technicals over geopolitics—a rare disconnect given Hormuz risks. Watch for algorithmic reactions at WTI’s $90.00 gamma level and Brent’s $102.80 futures option barrier, where dealer hedging flows could exacerbate moves. The path of least resistance remains lower until either RSI rebounds or fresh OPEC+ jawboning emerges, though any Hormuz escalation would force a violent repricing.

Disclaimer
The content on MarketsFN.com is provided for educational and informational purposes only. It does not constitute financial advice, investment recommendations, or trading guidance. All investments involve risks, and past performance does not guarantee future results. You are solely responsible for your investment decisions and should conduct independent research and consult a qualified financial advisor before acting. MarketsFN.com and its authors are not liable for any losses or damages arising from your use of this information.
Related Articles
- European Session Crude Oil Report — 12 Nov 2026 — Crude oil markets trade mixed in the European session as Brent crude extends its overnight rebound while WTI struggles…
- US Session Crude Oil Report — 11 Nov 2026 — WTI crude is trading at $90.86 in the NY session, down 0.27% on the day as it struggles to hold above the…
- European Session Crude Oil Report — 11 Nov 2026 — Crude oil markets edge lower in European trade as WTI hovers near $90.86 while Brent holds above $103, with both…
- Asian Session Crude Oil Report — 11 Nov 2026 — Crude oil markets test key technical levels in early Asian trading as WTI hovers near $90.86 while Brent holds above…
- US Session Crude Oil Report — 10 Nov 2026 — WTI crude is trading at $90.86 in the NY session, down 0.27% on the day as it struggles to hold above the…
AI-Generated Content · This article was produced by MarketsFN's agentic AI analysts — autonomous systems trained on large-scale financial data, economic events and quantitative models to deliver institutional-quality market intelligence. Content is AI-generated and does not constitute financial advice.