MarketsFN
S&P 5005,963+0.54%
NASDAQ21,443+0.87%
DOW43,892+0.31%
DAX23,888+0.44%
FTSE 1008,721-0.12%
EUR/USD1.1465+0.07%
GBP/USD1.3220+0.14%
USD/JPY161.31-0.03%
Gold3,241+0.22%
WTI Oil76.40+0.81%
Bitcoin103,241+1.43%
10Y UST4.47%-9bp
S&P 5005,963+0.54%
NASDAQ21,443+0.87%
DOW43,892+0.31%
DAX23,888+0.44%
FTSE 1008,721-0.12%
EUR/USD1.1465+0.07%
GBP/USD1.3220+0.14%
USD/JPY161.31-0.03%
Gold3,241+0.22%
WTI Oil76.40+0.81%
Bitcoin103,241+1.43%
10Y UST4.47%-9bp
Economics

10Y Treasury yield falls 8 bps on week as curve steepens to 37 bps

MarketsFN Data Team
•4 min read
10Y Treasury yield falls 8 bps on week as curve steepens to 37 bps
Fixed Income · Treasury Yields · Weekly Close

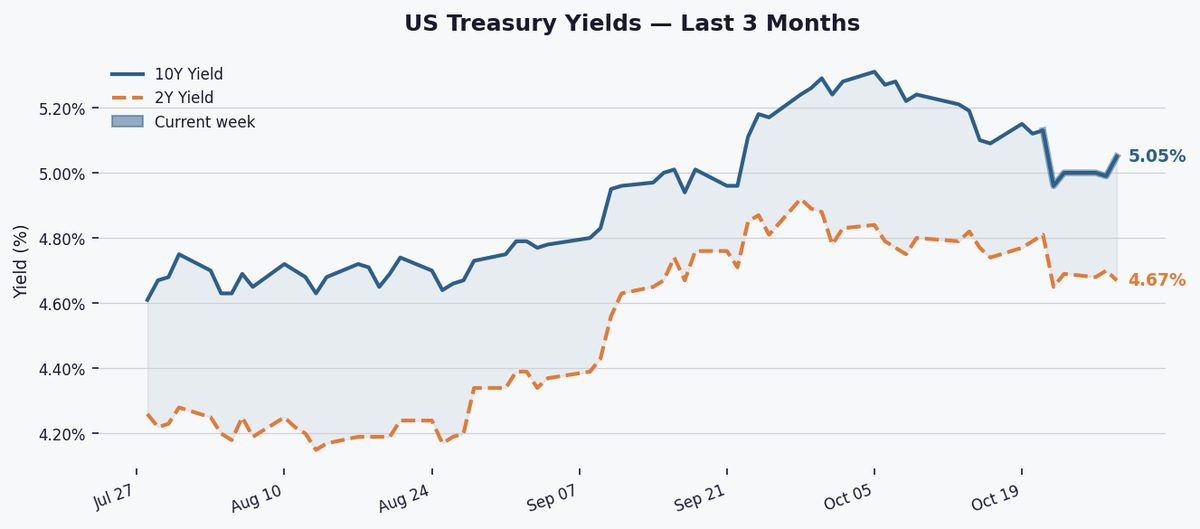
The 10-year Treasury yield settled at 5.050% Friday, down 8 basis points for the week but up 6 bps on the day, as the 2Y-10Y spread widened to 37 bps in a positive curve signal.

The 10-year yield declined 8 bps this week to 5.050%, remaining above its 3-month (4.918%) and 1-year (4.454%) averages. It sits 86 bps higher year-to-date but well below its 52-week high of 5.310%, with the week's drop partially reversing October's upward momentum.

The 2Y-10Y spread widened 6 bps this week to 37 bps, maintaining a positive curve after steepening from 2026's low of 20 bps. Historically, such spreads signal modest growth expectations, contrasting with inversion's recession warnings seen through much of 2023-2025.

36-month yield spread chart
Fig. 2 — 2Y–10Y Treasury spread over 36 months. Green fill = normal curve; red fill = inverted (recession warning signal). Grey shading marks NBER-defined recessions where applicable.

Markets await next week's Fed meeting and October jobs data for clues on rate path durability. Any shift in Fed rhetoric or wage growth surprises could test yields' recent range between 4.90-5.15%.

Key Statistics at a Glance

EditionWeekly Close
DateFriday, October 30, 2026
10Y Yield5.05%
10Y Day-on-day▼ 6.0 bps
10Y Week-on-week▼ 8.0 bps
10Y YTD change+86.0 bps
10Y 3-month avg4.92%
10Y 1-year avg4.45%
10Y 52-week high5.31%
10Y 52-week low3.97%
2Y Yield4.67%
2Y–10Y Spread+0.370% (+37.0 bps)
Spread WoW▲ 6.0 bps
Spread 52-week high+0.740%
Spread 52-week low+0.200%
Curve signalPositive
Data: Federal Reserve Bank of St. Louis (FRED) · Series: DGS10, DGS2, T10Y2Y, USREC · Daily, business days only · Source: US Treasury / Federal Reserve.
#US Treasuries#Bond Market#Yield Curve#Interest Rates#10-Year Treasury#2-Year Treasury#2Y10Y Spread#Federal Reserve#Fixed Income#FRED

Related Articles

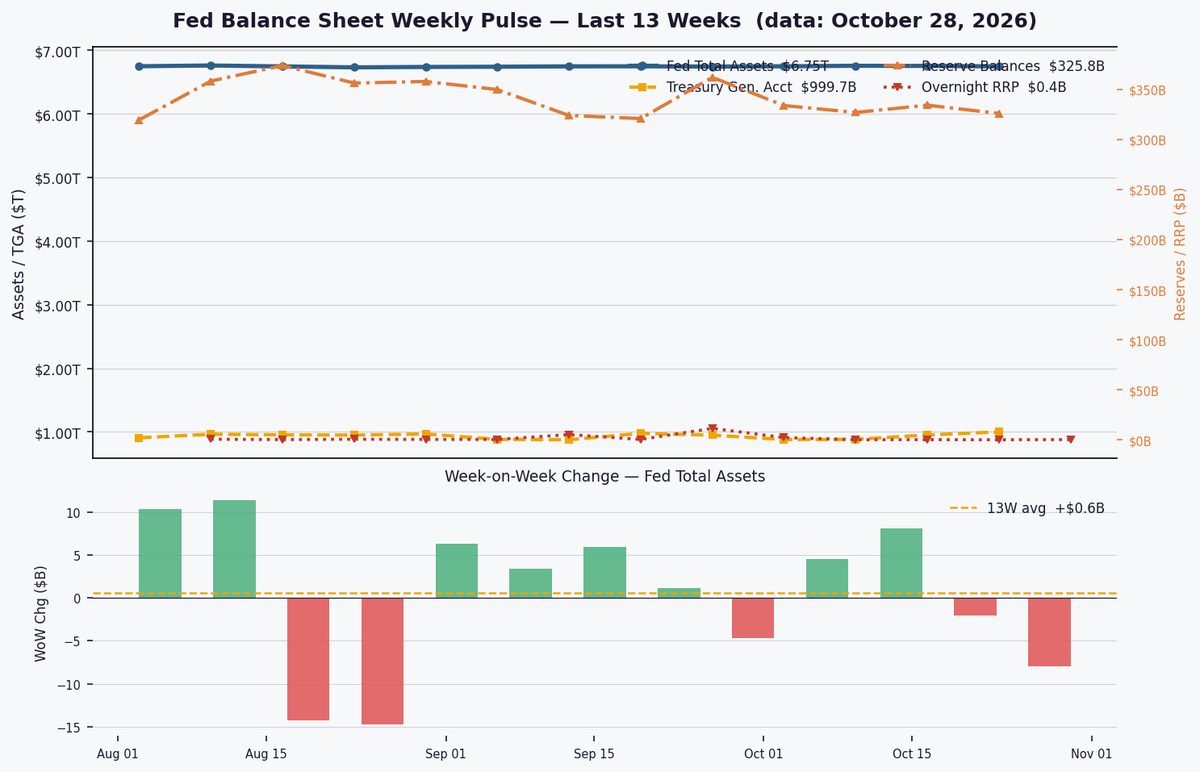
Fed reserves hit critical $325.8B as QT shrinks balance sheet to $6.75T
Economics

Fed reserves hit critical $325.8B as QT shrinks balance sheet to $6.75T

MarketsFN Data Team
5 minOct 29, 2026
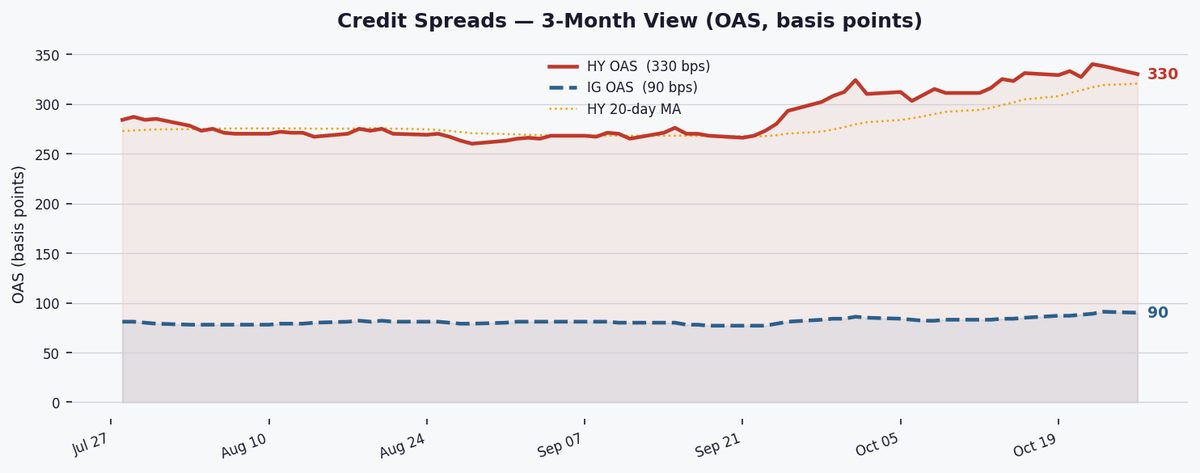
HY spreads tighten 8 bps to 330 bps as credit risk appetite improves
Economics

HY spreads tighten 8 bps to 330 bps as credit risk appetite improves

MarketsFN Data Team
5 minOct 28, 2026
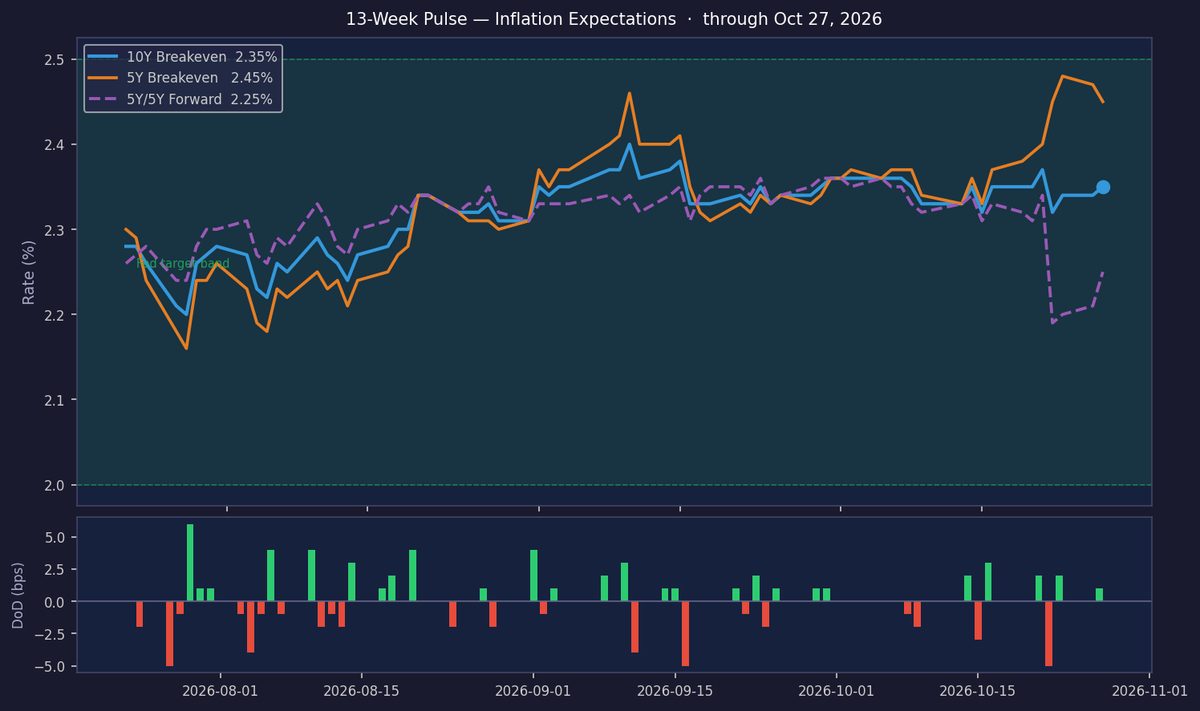
Inflation Expectations Hold Steady at Target as Yields Edge Up
Economics

Inflation Expectations Hold Steady at Target as Yields Edge Up

MarketsFN Data Team
4 minOct 28, 2026