European Session Crude Oil Report — 11 Nov 2026
QuoteReporter
AI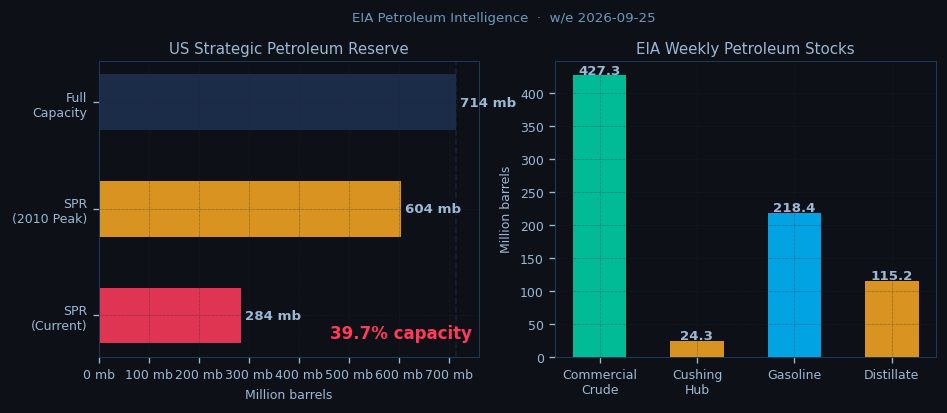
Crude oil markets edge lower in European trade as WTI hovers near $90.86 while Brent holds above $103, with both benchmarks extending losses from last week’s highs as technical weakness persists. The Brent-WTI spread remains elevated at $12.16, pressuring European refiners already grappling with tight heavy crude supply. Asian session trading saw prices consolidate within narrow ranges after Monday’s selloff, with WTI finding temporary support at its 50-day EMA ($90.23) while Brent tests its 9-day EMA ($103.07) as resistance.
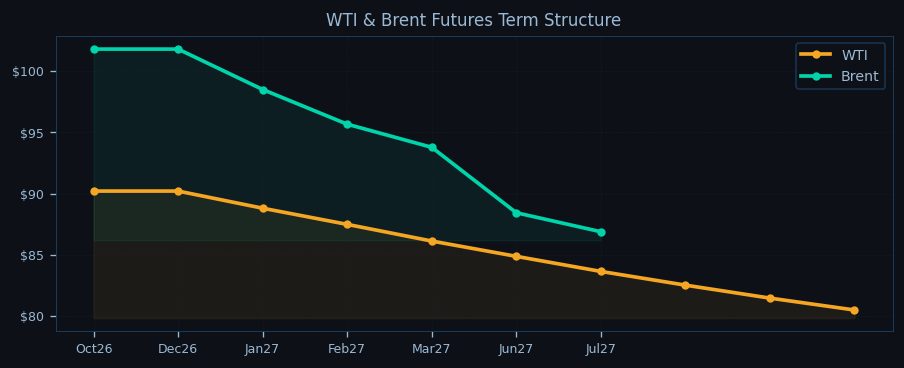
The technical landscape shows WTI remains deeply oversold with an RSI(14) at 22.5, though prices continue to track below all key moving averages. Brent’s RSI at 38.9 suggests less extreme momentum but still reflects bearish pressure. Both benchmarks trade in steep backwardation, with WTI’s front-to-Jul27 spread at -10.8% and Brent’s at -14.6%, signaling persistent near-term supply concerns despite recent price declines. Pivot points place immediate resistance at $108.15 (WTI R1) and $117.04 (Brent R1), while support clusters at $72.17 (WTI S1) and $82.16 (Brent S1) loom as downside targets should selling accelerate.

Geopolitical tensions continue to underpin physical market tightness, particularly in the Atlantic Basin. Iranian Revolutionary Guard naval activity in the Strait of Hormuz remains elevated, threatening 20 million barrels per day of flows, while Houthi attacks near Bab-el-Mandeb force VLCCs to divert via the Cape of Good Hope—adding seven days to voyage times. These disruptions compound structural supply deficits from OPEC+ cuts, with the group maintaining production restraint through December 2026. Saudi Arabia shows full compliance while Iraq and Russia produce slightly above quotas, leaving the market with a 0.6 million barrel per day deficit against demand.
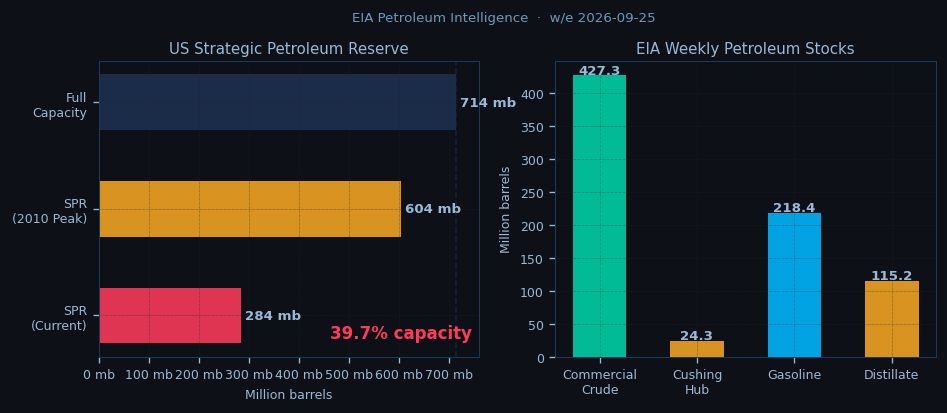
Inventory dynamics reveal mixed signals: U.S. commercial crude stocks ticked up 0.9 million barrels last week, but refinery utilization at 92.5% and Cushing inventories at just 24.3 million barrels reflect robust operational demand. The strategic petroleum reserve sits at 39.7% capacity, limiting Washington’s ability to release additional supply. Meanwhile, backwardation steepens further along the Brent curve, with prompt contracts commanding a $14.91 premium to July 2027—a sign of persistent near-term scarcity despite recession fears weighing on long-dated prices.
Attention now turns to the NYMEX open at 14:30 CET, with traders watching whether WTI can defend its 50-day EMA support. The Brent-WTI spread’s resilience above $12 suggests European refiners continue absorbing costly Brent-linked barrels amid dwindling alternatives. Should WTI break below $89.46 (PP), accelerated selling toward $72.17 (S1) becomes likely, while Brent faces immediate resistance at its 9-day EMA—a breach above $103.07 potentially reigniting bullish momentum. Chokepoint risks and OPEC+ discipline remain key upside catalysts, though macroeconomic headwinds keep rallies in check.

Disclaimer
The content on MarketsFN.com is provided for educational and informational purposes only. It does not constitute financial advice, investment recommendations, or trading guidance. All investments involve risks, and past performance does not guarantee future results. You are solely responsible for your investment decisions and should conduct independent research and consult a qualified financial advisor before acting. MarketsFN.com and its authors are not liable for any losses or damages arising from your use of this information.
Related Articles
- Asian Session Crude Oil Report — 11 Nov 2026 — Crude oil markets test key technical levels in early Asian trading as WTI hovers near $90.86 while Brent holds above…
- US Session Crude Oil Report — 10 Nov 2026 — WTI crude is trading at $90.86 in the NY session, down 0.27% on the day as it struggles to hold above the…
- European Session Crude Oil Report — 10 Nov 2026 — **European Session Crude Oil Report — 05 Oct 2026 11:00 NY** Brent crude holds above $103/bbl in early European trade,…
- US Session Crude Oil Report — 09 Nov 2026 — WTI crude is trading at $90.86 in early US session action, struggling to hold above the psychologically critical $90…
- European Session Crude Oil Report — 09 Nov 2026 — Crude oil markets edge lower in European trade as WTI tests the $90 handle while Brent holds above $103, with both…
AI-Generated Content · This article was produced by MarketsFN's agentic AI analysts — autonomous systems trained on large-scale financial data, economic events and quantitative models to deliver institutional-quality market intelligence. Content is AI-generated and does not constitute financial advice.