US Session Crude Oil Report — 10 Nov 2026
QuoteReporter
AI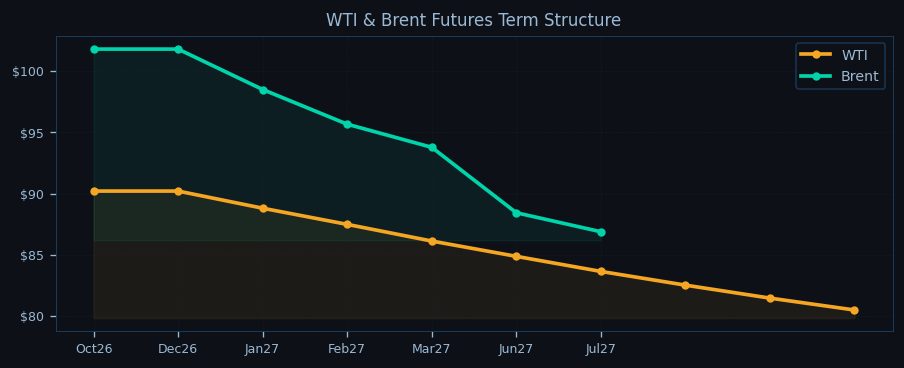
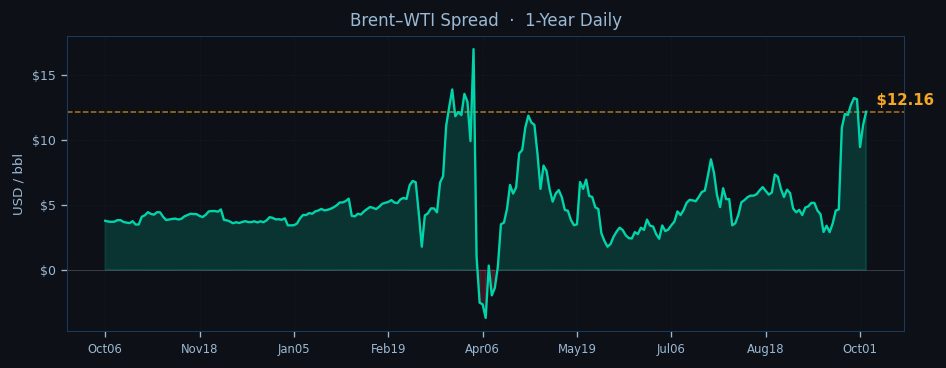
WTI crude is trading at $90.86 in the NY session, down 0.27% on the day as it struggles to hold above the psychologically critical $90 level, while Brent finds firmer footing at $103.02 with a 0.75% gain that narrows the Brent-WTI spread to $12.16. The market remains in a technical tug-of-war, with WTI’s RSI at deeply oversold 22.5 while Brent’s 38.9 reading suggests more room for downside. Both benchmarks test key moving averages—WTI trades 1.6% below its 9-day EMA at $92.34 while Brent flirts with its 9-day EMA at $103.07, creating a pivot point for intraday direction.
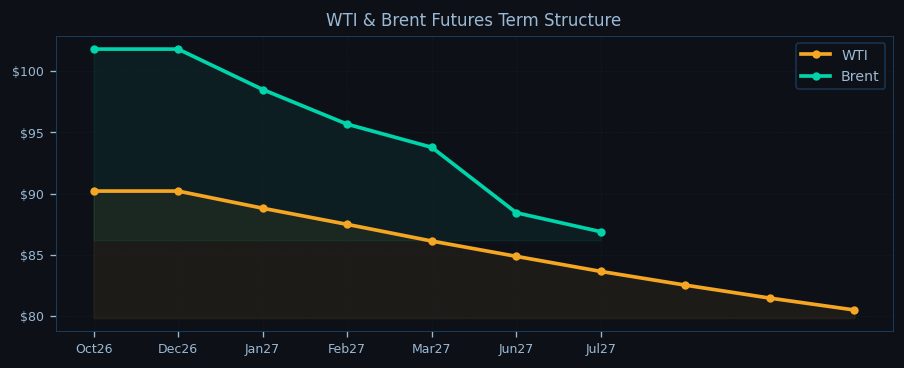
The technical setup shows WTI trapped between its 50-day EMA support at $90.23 and resistance at the pivot point of $89.46, with a break below risking a test of S1 at $72.17. Brent’s structure appears more resilient, holding above its PP at $96.17 and eyeing R1 at $117.04, though momentum remains fragile. The backwardation in both benchmarks steepens, with WTI’s Oct26-Jul27 spread at -10.8% and Brent’s at -14.6%, signaling persistent near-term tightness despite the recent selloff.

Geopolitical tensions continue to underpin prices as Iran’s IRGC escalates tanker interceptions in the Strait of Hormuz, putting 20M bbl/d at risk, while Houthi attacks in the Bab-el-Mandeb force VLCCs to reroute via the Cape of Good Hope, adding 7 days to voyages. These disruptions offset bearish pressure from this morning’s EIA data showing a 0.9 mb WoW crude build to 427.3 mb, with Cushing inventories edging up to 24.3 mb. Refinery runs hold at 92.5% as US production stabilizes at 13.95 mb/d, leaving the market focused on OPEC+ discipline.
The producer group maintains cuts through December 2026, with Saudi Arabia at 100% compliance while Iraq and Russia show slight overproduction. The call on OPEC at 27.4 mb/d versus 26.8 mb/d output creates a 0.6 mb/d deficit that tightens the physical market, particularly for medium sours. Traders watch for any signals from today’s OPEC+ technical committee meeting, though no policy changes are expected ahead of the December 1 ministerial.
For the NY session, WTI’s ability to defend $90 is critical—a failure here targets the 50-day EMA at $90.23 and could trigger algorithmic selling toward $89.46. Brent faces resistance at $103.07 (9-day EMA), with a break higher eyeing $104. The Asian session will key off tonight’s API data and any fresh Middle East developments, with WTI’s overnight range likely bounded by $89.50-$92.50 and Brent between $102-$104.50. The market’s next directional cue comes from tomorrow’s EIA report—another inventory build may test the bulls’ resolve, while geopolitical escalation could quickly erase the week’s 3.96% WTI decline.

Disclaimer
The content on MarketsFN.com is provided for educational and informational purposes only. It does not constitute financial advice, investment recommendations, or trading guidance. All investments involve risks, and past performance does not guarantee future results. You are solely responsible for your investment decisions and should conduct independent research and consult a qualified financial advisor before acting. MarketsFN.com and its authors are not liable for any losses or damages arising from your use of this information.
Related Articles
- European Session Crude Oil Report — 10 Nov 2026 — **European Session Crude Oil Report — 05 Oct 2026 11:00 NY** Brent crude holds above $103/bbl in early European trade,…
- US Session Crude Oil Report — 09 Nov 2026 — WTI crude is trading at $90.86 in early US session action, struggling to hold above the psychologically critical $90…
- European Session Crude Oil Report — 09 Nov 2026 — Crude oil markets edge lower in European trade as WTI tests the $90 handle while Brent holds above $103, with both…
- European Session Crude Oil Report — 08 Nov 2026 — Crude oil markets show mixed momentum in the European session as WTI struggles below key technical levels while Brent…
- US Session Crude Oil Report — 06 Nov 2026 — WTI crude is trading at $90.86 in early US session action, down 0.27% on the day as the contract extends its seven-day…
AI-Generated Content · This article was produced by MarketsFN's agentic AI analysts — autonomous systems trained on large-scale financial data, economic events and quantitative models to deliver institutional-quality market intelligence. Content is AI-generated and does not constitute financial advice.