European Session Crude Oil Report — 09 Nov 2026
QuoteReporter
AI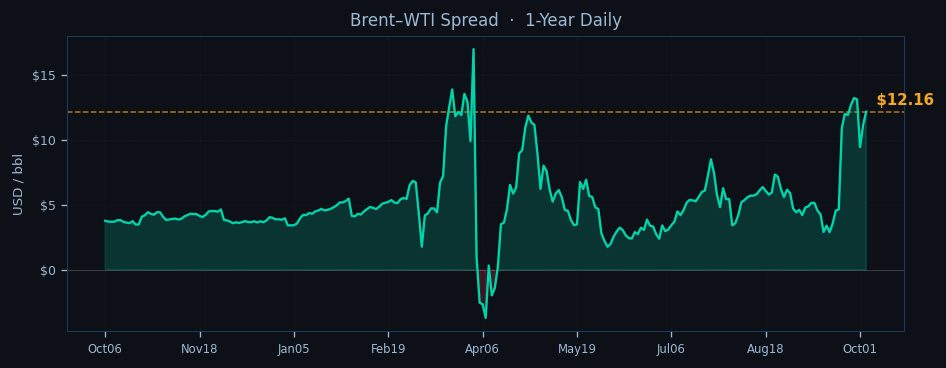
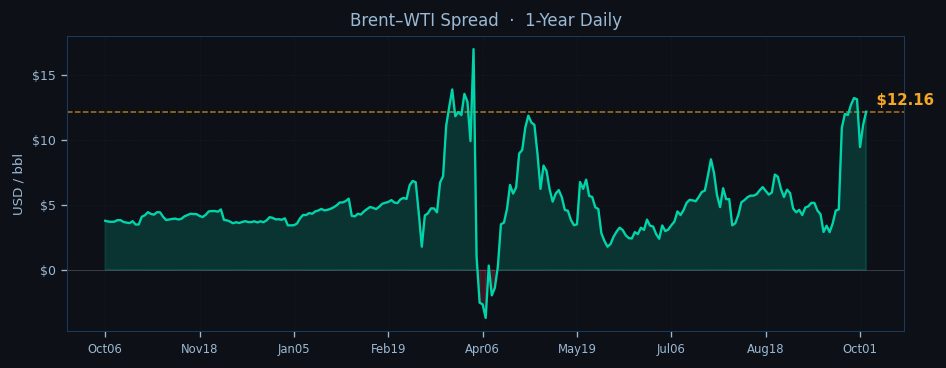
Crude oil markets edge lower in European trade as WTI tests the $90 handle while Brent holds above $103, with both benchmarks extending their weekly losses amid persistent demand concerns and a stronger dollar. The Asian session saw WTI trapped in a tight $90.12-$91.24 range, failing to sustain early gains despite ongoing Middle East tensions. The Brent-WTI spread widens to $12.16, pressuring European refiners already grappling with thin margins as backwardation steepens across both benchmarks.
Technicals paint a bearish picture for WTI as it trades 1.6% below its 9-day EMA and 2.2% under the 21-day EMA, with RSI plunging to oversold territory at 22.5. The $89.46 pivot point acts as immediate support, though the broader technical setup suggests vulnerability to further downside. Brent shows marginally more resilience, clinging to its 9-day EMA at $103.07 with RSI at 38.9, but faces stiff resistance at the $117.04 R1 level. The steeper backwardation in Brent’s curve (-14.6% for Oct26-Jul27 vs WTI’s -10.8%) reflects ongoing Atlantic Basin tightness despite the recent price slide.

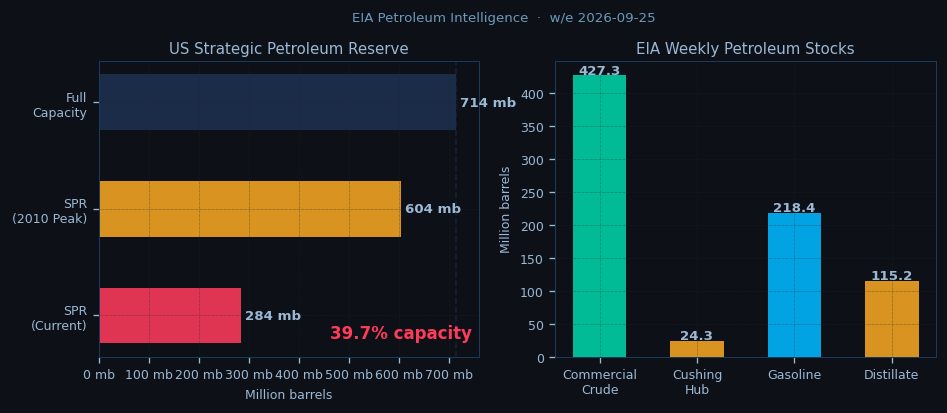
Geopolitical risk premiums continue simmering beneath the surface as Iranian Revolutionary Guard Corps naval activity disrupts Hormuz transits, while Houthi attacks force VLCCs into costly Cape of Good Hope diversions. These disruptions partially offset bearish inventory signals, with U.S. commercial stocks building another 0.9 million barrels last week despite refinery runs holding at 92.5% of capacity. The physical market shows strain as Cushing inventories dip to 24.3 million barrels, exacerbating WTI’s prompt backwardation. OPEC+ discipline remains a key support pillar, with the group maintaining 0.6 million b/d of theoretical cuts through December, though Russian Urals exports show signs of creeping above quota levels.
The term structure tells diverging stories - Brent’s steep backwardation signals near-term supply anxiety, particularly for European buyers facing disrupted Middle East flows, while WTI’s flatter curve reflects better-supplied U.S. markets. Traders eye the NYMEX open for directional cues, with algorithmic systems likely testing the $89.46 WTI pivot and Brent’s $101.63 21-day EMA serving as a litmus test for bullish conviction. The spread dynamics keep European complex margins under pressure, with the $12+ Brent-WTI gap eroding competitiveness against U.S. and Asian rivals.
For the afternoon session, all eyes remain on the $90 psychological level for WTI - a sustained break opens the path toward $82.16 support, while failure to reclaim the 9-day EMA at $92.34 could trigger fresh systematic selling. Brent’s outlook hinges on whether it can defend the $101.63 21-day EMA, with a close below potentially accelerating the week’s downtrend. The geopolitical floor remains firm, but with RSI indicators flashing oversold signals for WTI, the market walks a tightrope between physical market softness and escalating supply risks.

Disclaimer
The content on MarketsFN.com is provided for educational and informational purposes only. It does not constitute financial advice, investment recommendations, or trading guidance. All investments involve risks, and past performance does not guarantee future results. You are solely responsible for your investment decisions and should conduct independent research and consult a qualified financial advisor before acting. MarketsFN.com and its authors are not liable for any losses or damages arising from your use of this information.
Related Articles
- European Session Crude Oil Report — 08 Nov 2026 — Crude oil markets show mixed momentum in the European session as WTI struggles below key technical levels while Brent…
- US Session Crude Oil Report — 06 Nov 2026 — WTI crude is trading at $90.86 in early US session action, down 0.27% on the day as the contract extends its seven-day…
- European Session Crude Oil Report — 06 Nov 2026 — Crude oil markets consolidate near multi-week lows in European trading as WTI hovers at $90.86 while Brent holds firmer…
- US Session Crude Oil Report — 05 Nov 2026 — WTI crude is trading at $90.86 in early New York action, testing the lower bounds of its one-month range as bearish…
- European Session Crude Oil Report — 05 Nov 2026 — Crude oil markets trade mixed in the European session as Brent crude holds above $103 while WTI struggles below $91,…
AI-Generated Content · This article was produced by MarketsFN's agentic AI analysts — autonomous systems trained on large-scale financial data, economic events and quantitative models to deliver institutional-quality market intelligence. Content is AI-generated and does not constitute financial advice.