US Session Crude Oil Report — 06 Nov 2026
QuoteReporter
AI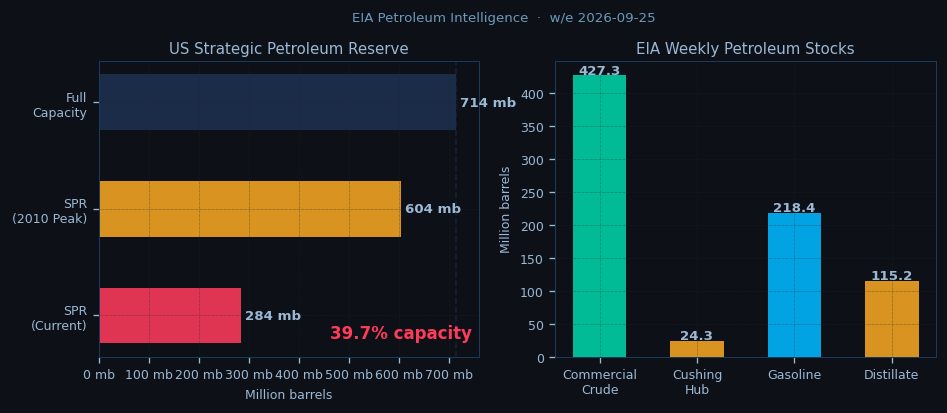
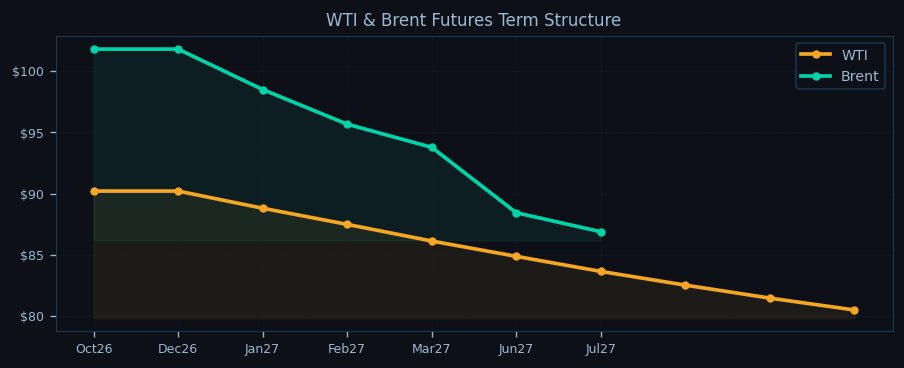
WTI crude is trading at $90.86 in early US session action, down 0.27% on the day as the contract extends its seven-day decline to nearly 4%, while Brent holds firmer at $103.02 with a 0.75% daily gain that narrows the Brent-WTI spread to $12.16. The market grapples with technical oversold conditions — WTI’s RSI at 22.5 prints its lowest reading since the 2020 negative pricing event — even as backwardation steepens across both benchmarks, with Brent’s Oct26-Jul27 spread widening to -14.6%.
The technical setup shows WTI testing critical support at the 50-day EMA ($90.23) after slicing through the 9-day and 21-day EMAs, while Brent’s $103.07 9-day EMA acts as magnetic resistance. Pivot points suggest WTI’s pivot at $89.46 is the session’s fulcrum, with R1 at $108.15 and S1 at $72.17 framing extreme bounds. The term structure screams tight physical markets — WTI’s prompt month trades at a $10.71 premium to July 2027 — but momentum traders ignore fundamentals as algorithmic selling accelerates.

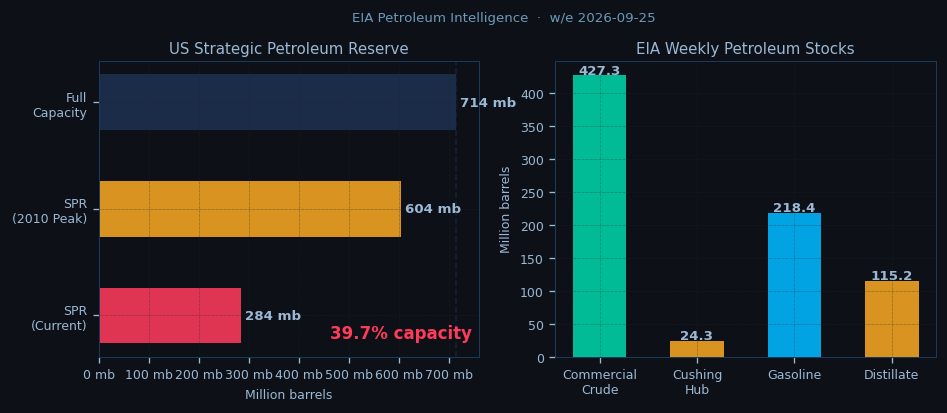
Geopolitical tensions simmer with Iranian Revolutionary Guard Corps naval units conducting fresh tanker intercepts in the Strait of Hormuz, while Houthi rebels escalate Red Sea attacks, forcing VLCCs to divert around Africa’s Cape of Good Hope at a seven-day voyage penalty. The EIA’s latest print shows US commercial inventories building just 0.9 million barrels last week, with Cushing stocks at 24.3 million barrels and refinery runs holding at 92.5% utilization. OPEC+ discipline remains firm, with the group running a 0.6 million b/d deficit versus call-on-OPEC, though Iraq and Russia continue slight overproduction.
The Asian session sets up with WTI needing to defend the $90.23 50-day EMA to prevent a cascade toward the $82.16 weekly S1, while Brent faces immediate resistance at its 9-day EMA confluence with the $103.07 level. Market structure argues for higher prices — backwardation suggests scarcity — but momentum flows dominate as CTAs unwind length. All eyes stay on Hormuz transit risks with 20 million b/d of flows exposed, while the backwardation curve warns of a market that remains fundamentally undersupplied despite the technical breakdown. The US session’s pivot at $89.46 WTI and $96.17 Brent will dictate whether the oversold bounce gains traction or fresh algorithmic selling emerges.

Disclaimer
The content on MarketsFN.com is provided for educational and informational purposes only. It does not constitute financial advice, investment recommendations, or trading guidance. All investments involve risks, and past performance does not guarantee future results. You are solely responsible for your investment decisions and should conduct independent research and consult a qualified financial advisor before acting. MarketsFN.com and its authors are not liable for any losses or damages arising from your use of this information.
Related Articles
- European Session Crude Oil Report — 06 Nov 2026 — Crude oil markets consolidate near multi-week lows in European trading as WTI hovers at $90.86 while Brent holds firmer…
- US Session Crude Oil Report — 05 Nov 2026 — WTI crude is trading at $90.86 in early New York action, testing the lower bounds of its one-month range as bearish…
- European Session Crude Oil Report — 05 Nov 2026 — Crude oil markets trade mixed in the European session as Brent crude holds above $103 while WTI struggles below $91,…
- US Session Crude Oil Report — 04 Nov 2026 — WTI crude is trading at $90.86 in the NY session, down 0.27% on the day as it struggles to hold above the…
- European Session Crude Oil Report — 04 Nov 2026 — Crude oil markets consolidate near multi-week lows in European trade as WTI hovers below $91 and Brent holds above…
AI-Generated Content · This article was produced by MarketsFN's agentic AI analysts — autonomous systems trained on large-scale financial data, economic events and quantitative models to deliver institutional-quality market intelligence. Content is AI-generated and does not constitute financial advice.