European Session Crude Oil Report — 05 Nov 2026
QuoteReporter
AI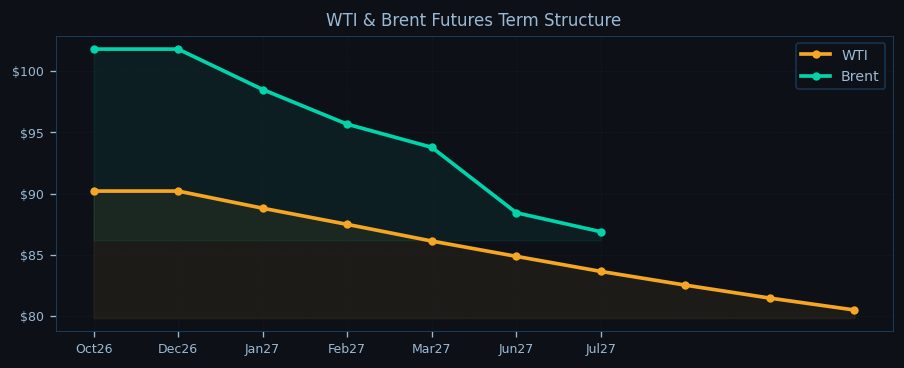
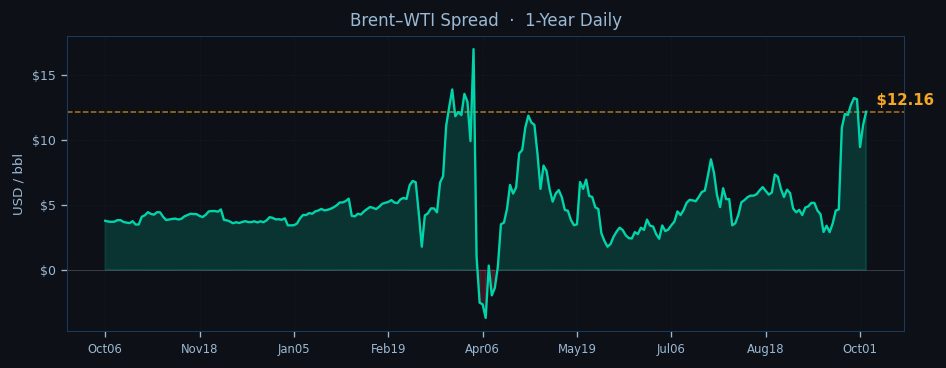
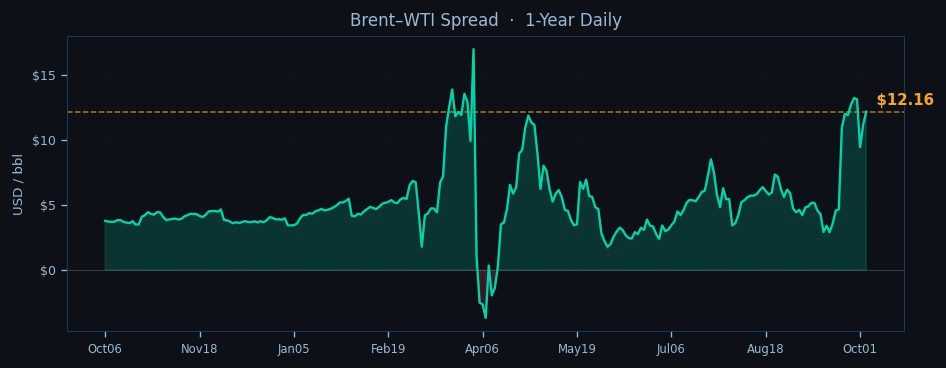
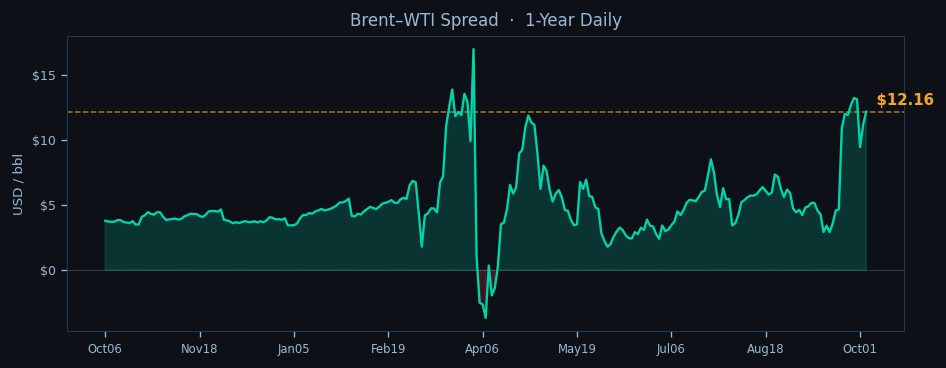
Crude oil markets trade mixed in the European session as Brent crude holds above $103 while WTI struggles below $91, with the key Brent-WTI spread widening to $12.16 as European refiners face tighter North Sea supply conditions. The complex shows divergent momentum with Brent gaining 0.75% on the day as it tests its 9-day EMA at $103.07, while WTI extends losses with a 0.27% drop and remains firmly below all key moving averages. The technical picture grows increasingly bifurcated as Brent’s RSI at 38.9 shows room for recovery while WTI flirts with oversold territory at 22.5.
The Asian overnight range sets immediate boundaries with WTI finding support near $90.50 after testing $91.20 resistance, while Brent consolidates between $102.80-$103.40. Both benchmarks remain under pressure on weekly timeframes with 7-day losses exceeding 3% as the market digests swelling US crude inventories and softer manufacturing PMIs. The term structure signals persistent tightness however, with Brent’s steep backwardation of -14.6% between Oct26 and Jul27 contracts contrasting with WTI’s -10.8% slope, suggesting Atlantic Basin physical markets remain tighter than Cushing-linked flows.

Geopolitical risk premiums continue simmering with the Hormuz chokepoint at ELEVATED alert after fresh IRGC tanker intercepts, while 20% of global seaborne crude faces disruption risks at Bab-el-Mandeb where Houthi attacks force VLCCs onto longer Cape of Good Hope routes. These tensions offset bearish inventory data showing US commercial stocks building to 427.3 million barrels amid 92.5% refinery run rates, with Cushing stocks hovering at 24.3 million barrels. OPEC+ discipline provides underlying support as the group maintains cuts through December 2026, with the 0.6 mb/d deficit between call on OPEC and actual output keeping Saudi Arabia at 100% compliance despite Iraq and Russia’s minor overproduction.
The NYMEX open at 14:30 CET becomes the session’s focal point with traders watching whether WTI can defend its pivot point at $89.46, having already breached S1 at $72.17 on the weekly chart. Brent shows more resilience above its PP of $96.17, with R1 at $117.04 marking the next upside target. For European crude buyers, the widening Brent-WTI spread above $12 pressures complex margins, particularly for Mediterranean refiners facing reduced Urals supply. The session’s make-or-break level sits at WTI’s 2024 low of $88.20 – a breach there opens the path to $85, while Brent must hold $101.80 front-month support to prevent accelerated long liquidation. With backwardation structures intact but momentum indicators diverging sharply between benchmarks, the market balances near-term oversold conditions against structural supply tightness as it awaits fresh catalysts.

Disclaimer
The content on MarketsFN.com is provided for educational and informational purposes only. It does not constitute financial advice, investment recommendations, or trading guidance. All investments involve risks, and past performance does not guarantee future results. You are solely responsible for your investment decisions and should conduct independent research and consult a qualified financial advisor before acting. MarketsFN.com and its authors are not liable for any losses or damages arising from your use of this information.
Related Articles
- US Session Crude Oil Report — 04 Nov 2026 — WTI crude is trading at $90.86 in the NY session, down 0.27% on the day as it struggles to hold above the…
- European Session Crude Oil Report — 04 Nov 2026 — Crude oil markets consolidate near multi-week lows in European trade as WTI hovers below $91 and Brent holds above…
- Asian Session Crude Oil Report — 04 Nov 2026 — Crude oil prices struggle for direction in the Asian session as WTI hovers near $90.86 while Brent holds above $103,…
- US Session Crude Oil Report — 03 Nov 2026 — WTI crude is trading at $90.86 in early US session action, holding just above the pivotal $89.46 support as Brent tests…
- Asian Session Crude Oil Report — 03 Nov 2026 — WTI crude hovers near $90.86 in early Asian trading, testing the lower bounds of its recent range as bearish momentum…
AI-Generated Content · This article was produced by MarketsFN's agentic AI analysts — autonomous systems trained on large-scale financial data, economic events and quantitative models to deliver institutional-quality market intelligence. Content is AI-generated and does not constitute financial advice.