US Session Crude Oil Report — 05 Nov 2026
QuoteReporter
AI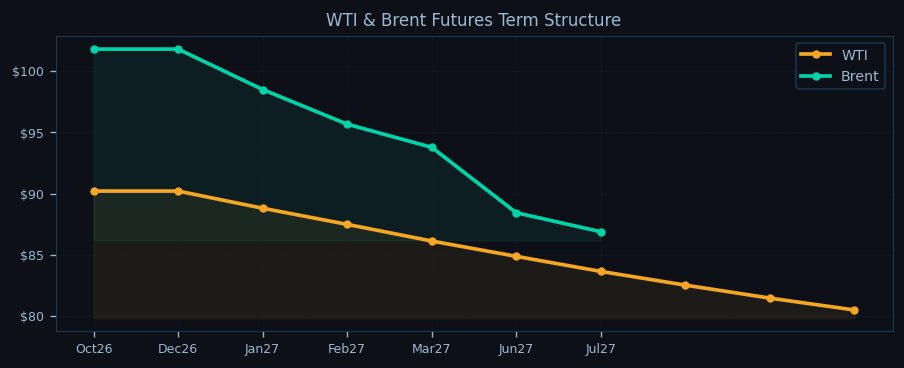
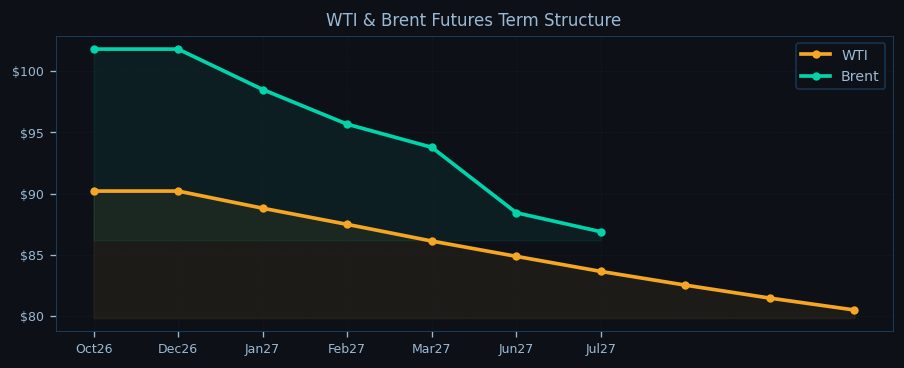
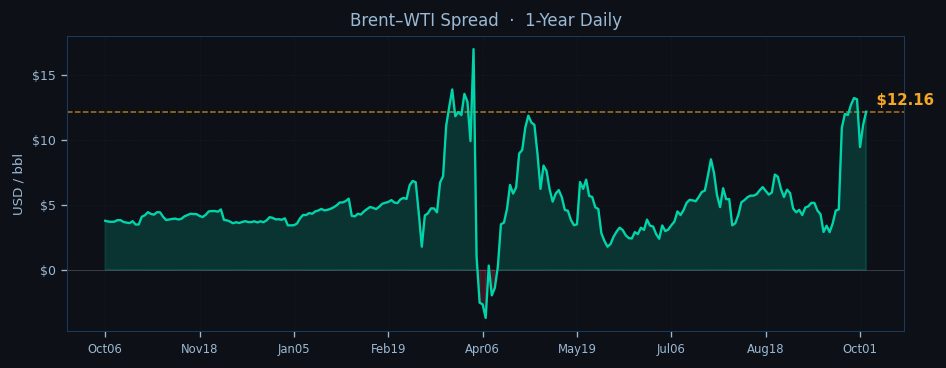
WTI crude is trading at $90.86 in early New York action, testing the lower bounds of its one-month range as bearish momentum extends into a third consecutive session. The contract faces selling pressure below its 9-day EMA at $92.34, with RSI(14) at oversold 22.5 signaling potential exhaustion. Brent shows relative strength at $103.02, though the $12.16 spread remains near the upper end of its three-year range. Both benchmarks trade in steep backwardation, with WTI Oct26/Jul27 at -10.8% and Brent at -14.6%, sustaining structural tightness signals despite recent price declines.
The technical setup shows WTI struggling to hold above its pivot point at $89.46, with immediate resistance at $92.90 (21-day EMA) and critical support at $72.17 (S1). Brent’s EMA cluster between $101.63 and $103.07 creates a congestion zone, while its RSI at 38.9 avoids oversold territory. The Brent-WTI spread widens as Atlantic Basin tightness persists, with VLCC rerouting around Africa adding $1.50/bbl to freight costs. Asian session levels see WTI finding bids at $90.50 overnight, while Brent defends $102.80 – both markers now testing those thresholds as New York liquidity builds.

Geopolitical tensions maintain a risk premium, with Iranian Revolutionary Guard Corps patrols intercepting tankers near Hormuz (20M bbl/d flow at risk). Houthi attacks in Bab-el-Mandeb force 7-day diversions for Suez-bound VLCCs, though Malacca and Suez transit flows normalize. OPEC+ discipline shows cracks as Iraq and Russia exceed quotas by 120kb/d collectively, though Saudi maintains 100% compliance. The group’s cuts through December 2026 leave markets facing a 0.6mb/d deficit against call-on-OPEC demand.
Today’s EIA data (Wednesday release) shows US commercial stocks building 0.9mb to 427.3mb last week, with Cushing inventories at 24.3mb and refinery runs holding at 92.5%. Domestic production edges down to 13.95mb/d, while the SPR remains depleted at 39.7% capacity. The report does little to alter the structural tightness narrative, with backwardation steepening in both benchmarks.
The session outlook hinges on whether WTI can defend $90.50 support, with a break risking a test of $89.46 (PP). Brent’s $103 level acts as magnet, with upside capped by the 9-day EMA at $103.07. Asian session traders will watch for Middle East crude allocations post-OPEC+ cuts, with Aramex OSPs expected to reflect strong distillate cracks. The backwardation structure suggests physical buyers emerge on dips, though algorithmic selling pressures near-term contracts amid recession hedging flows. Key for afternoon trade is whether Brent can reclaim its 21-day EMA at $101.63 – failure here may trigger additional long liquidation.

Disclaimer
The content on MarketsFN.com is provided for educational and informational purposes only. It does not constitute financial advice, investment recommendations, or trading guidance. All investments involve risks, and past performance does not guarantee future results. You are solely responsible for your investment decisions and should conduct independent research and consult a qualified financial advisor before acting. MarketsFN.com and its authors are not liable for any losses or damages arising from your use of this information.
Related Articles
- European Session Crude Oil Report — 05 Nov 2026 — Crude oil markets trade mixed in the European session as Brent crude holds above $103 while WTI struggles below $91,…
- US Session Crude Oil Report — 04 Nov 2026 — WTI crude is trading at $90.86 in the NY session, down 0.27% on the day as it struggles to hold above the…
- European Session Crude Oil Report — 04 Nov 2026 — Crude oil markets consolidate near multi-week lows in European trade as WTI hovers below $91 and Brent holds above…
- Asian Session Crude Oil Report — 04 Nov 2026 — Crude oil prices struggle for direction in the Asian session as WTI hovers near $90.86 while Brent holds above $103,…
- US Session Crude Oil Report — 03 Nov 2026 — WTI crude is trading at $90.86 in early US session action, holding just above the pivotal $89.46 support as Brent tests…
AI-Generated Content · This article was produced by MarketsFN's agentic AI analysts — autonomous systems trained on large-scale financial data, economic events and quantitative models to deliver institutional-quality market intelligence. Content is AI-generated and does not constitute financial advice.