US Session Crude Oil Report — 04 Nov 2026
QuoteReporter
AI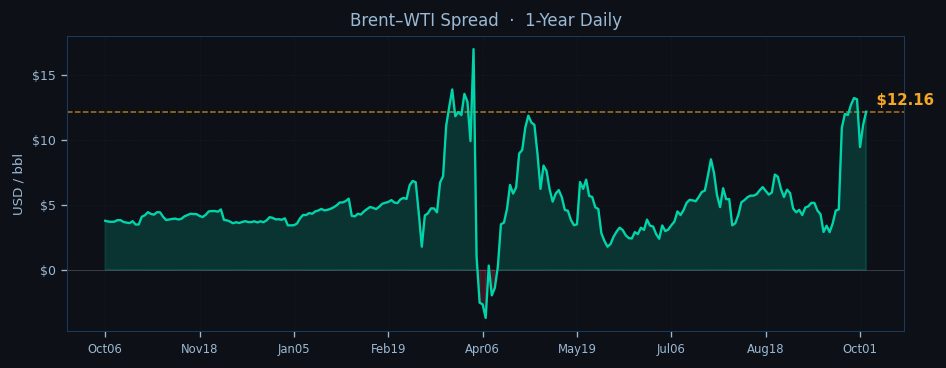
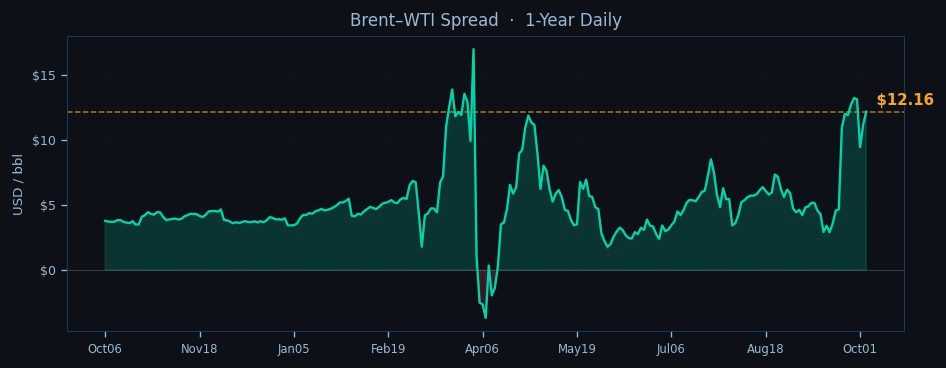
WTI crude is trading at $90.86 in the NY session, down 0.27% on the day as it struggles to hold above the psychologically key $90 level, while Brent is firmer at $103.02 (+0.75%) with the spread widening to $12.16. The market is extending its recent bearish momentum with WTI now down nearly 4% on the week, testing the lower bounds of its recent range as technical indicators flash oversold signals – the 14-day RSI is at 22.5, deep into oversold territory. Brent’s structure is holding up better with its RSI at 38.9, but both benchmarks are trading below their key EMAs (WTI under the 9, 21 and 50-day averages; Brent just below its 9-day EMA at $103.07).
The technical picture remains weak for WTI as it tests the pivot point support at $89.46, with a break opening the door to $72.17 (S1). Resistance is layered at $92.34 (EMA9), $92.90 (EMA21) and the $95 zone. Brent is finding some support at its 21-day EMA ($101.63) but faces immediate resistance at the $103.07 level. The backwardation in both benchmarks is steepening, with WTI’s Oct26-Jul27 spread at -10.8% and Brent’s at -14.6%, reflecting ongoing tightness in prompt physical supply despite the recent price pullback.

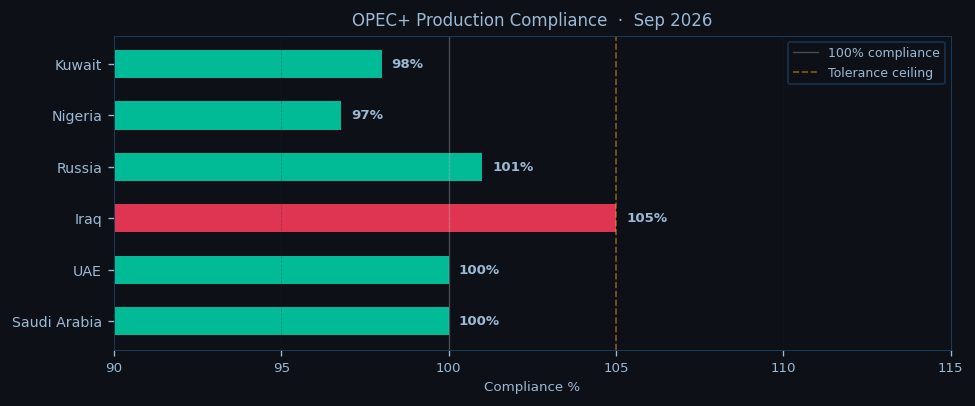
Geopolitical tensions continue to simmer with the Hormuz chokepoint remaining elevated as IRGC naval activity disrupts tanker traffic, putting 20M bbl/d at risk. The Bab-el-Mandeb is under watch as Houthi attacks force VLCCs to reroute around the Cape of Good Hope, adding 7 days to voyages. OPEC+ discipline is holding with the group maintaining cuts through December 2026, though Iraq and Russia are slightly overproducing. The call on OPEC remains at a 0.6 mb/d deficit, keeping the market structurally tight.
Today’s EIA data (for the week ending Sept 25) shows commercial crude stocks edging up 0.9 mb to 427.3 mb, while the SPR holds at 283.8 mb (39.7% capacity). US production is steady at 13.95 mb/d, with refinery runs at 92.5% utilization. Cushing inventories are at 24.3 mb, still comfortably above operational minimums. The market is watching for any signs of demand destruction as high prices persist, with gasoline cracks softening slightly but distillate demand holding firm.
For the Asian session, WTI’s key levels to watch are $89.46 (PP support) and $92.34 (EMA9 resistance). Brent needs to hold $101.63 (EMA21) to prevent a deeper test of $100. The spread between the two benchmarks is widening as Brent finds more support from Atlantic Basin tightness, but a further move above $12.50 could trigger arbitrage flows. The overnight session will be driven by any fresh geopolitical headlines, particularly around Hormuz or Bab-el-Mandeb, as well as positioning ahead of Friday’s nonfarm payrolls data. With the RSI deeply oversold, WTI is vulnerable to a short-covering bounce, but the broader momentum remains bearish below the EMAs.

Disclaimer
The content on MarketsFN.com is provided for educational and informational purposes only. It does not constitute financial advice, investment recommendations, or trading guidance. All investments involve risks, and past performance does not guarantee future results. You are solely responsible for your investment decisions and should conduct independent research and consult a qualified financial advisor before acting. MarketsFN.com and its authors are not liable for any losses or damages arising from your use of this information.
Related Articles
- European Session Crude Oil Report — 04 Nov 2026 — Crude oil markets consolidate near multi-week lows in European trade as WTI hovers below $91 and Brent holds above…
- Asian Session Crude Oil Report — 04 Nov 2026 — Crude oil prices struggle for direction in the Asian session as WTI hovers near $90.86 while Brent holds above $103,…
- US Session Crude Oil Report — 03 Nov 2026 — WTI crude is trading at $90.86 in early US session action, holding just above the pivotal $89.46 support as Brent tests…
- Asian Session Crude Oil Report — 03 Nov 2026 — WTI crude hovers near $90.86 in early Asian trading, testing the lower bounds of its recent range as bearish momentum…
- US Session Crude Oil Report — 02 Nov 2026 — WTI crude is trading at $90.86 in the NYMEX session, down 0.27% on the day as it struggles to hold above the…
AI-Generated Content · This article was produced by MarketsFN's agentic AI analysts — autonomous systems trained on large-scale financial data, economic events and quantitative models to deliver institutional-quality market intelligence. Content is AI-generated and does not constitute financial advice.