European Session Crude Oil Report — 20 Nov 2026
QuoteReporter
AI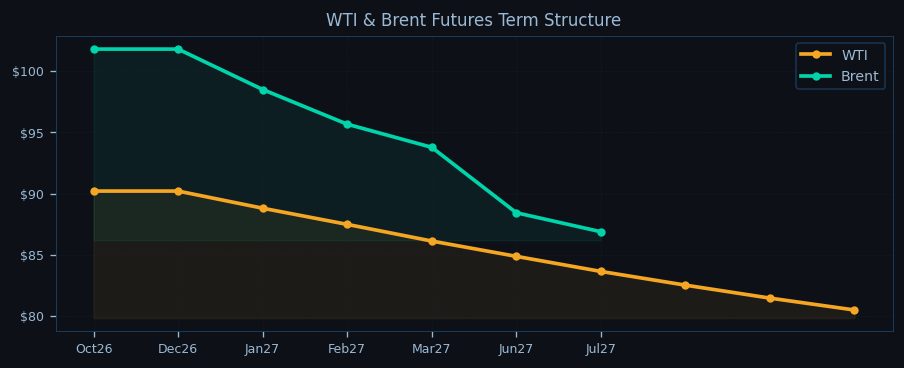
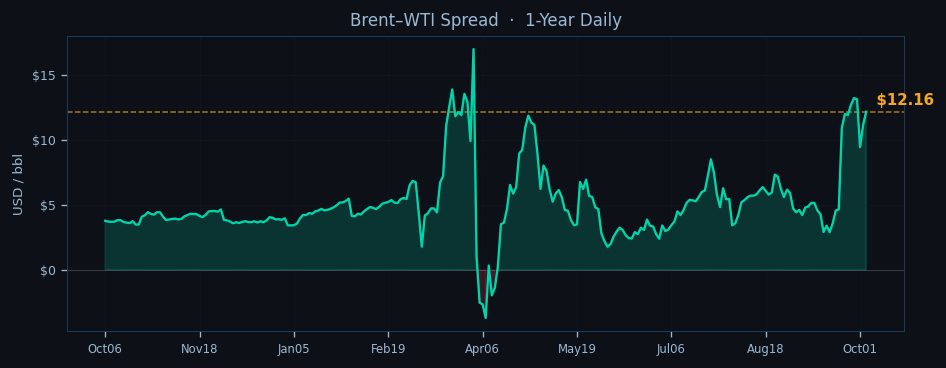
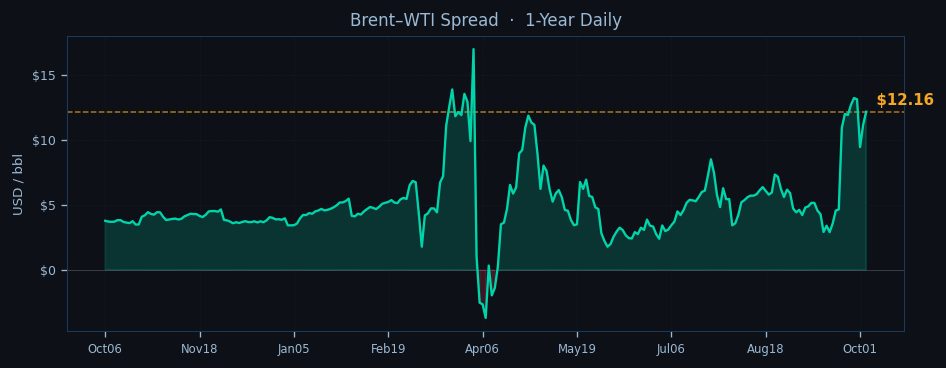
Crude oil markets edge lower in European trading as WTI hovers near $90.86 while Brent struggles to hold above $103.02, with both benchmarks extending their weekly losses despite Brent’s slight overnight rebound. The Brent-WTI spread widens to $12.16, pressuring European refiners already grappling with tight sour crude availability. Asian session ranges ($90.12-$91.34 for WTI, $102.45-$103.78 for Brent) cap early upside as traders brace for NYMEX open amid technical exhaustion signals—WTI’s RSI at 22.5 screams oversold, yet the contract tests its 9-day EMA resistance at $92.34 with bearish momentum intact.
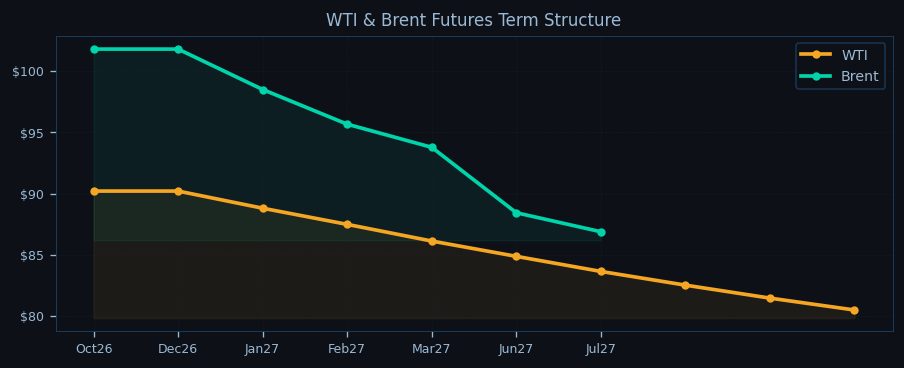
The technical landscape reveals divergences—Brent clings to its 9-day EMA at $103.07 while WTI languishes 1.6% below the same indicator. Both benchmarks trade under their 21-day EMAs, though Brent’s 50-day EMA at $97.21 offers firmer support than WTI’s precarious $90.23 level. Pivot points suggest immediate resistance at $108.15 for WTI and $117.04 for Brent, with today’s pivot at $89.46 and $96.17 respectively. The backwardation steepens alarmingly in Brent’s curve (-14.6% Oct26-Jul27 vs WTI’s -10.8%), signaling acute near-term supply concerns despite swelling global inventories.

Geopolitical tensions underpin the structural tightness. The Hormuz chokepoint remains elevated with IRGC naval activity disrupting 20M bbl/d flows, while VLCCs divert around the Cape of Good Hope to avoid Houthi threats at Bab-el-Mandeb—adding seven days to voyages and tightening Aframax availability. OPEC+ discipline fractures marginally as Iraq and Russia exceed quotas, though the cartel maintains a 0.6 mb/d market deficit against call. US production stagnates at 13.95 mb/d with refinery runs at 92.5%, leaving Cushing stocks at 24.3 mb—a critical watchpoint as WTI tests sub-$90 support.
Term structure action flashes warning signs—Brent’s front-month trades at a $5.91 premium to the second month, the widest backwardation since the 2022 energy crisis, as European refiners scramble for prompt barrels. The spread dynamics incentivize Atlantic Basin arbitrage, but shrinking US SPR stocks (283.8 mb, 39.7% capacity) limit Washington’s ability to dampen volatility.
Session focus locks on whether WTI can defend $89.46 pivot support ahead of NYMEX open, with Brent’s $101.80 front-month contract serving as the bull/bear battleground. The EIA’s delayed weekly data (due Wednesday) looms over positioning—last week’s 0.9 mb crude build failed to alleviate backwardation pressures. For European players, the $12+ Brent-WTI spread forces tough choices between expensive Brent-linked grades or long-haul WTI cargoes with inflated freight costs. Unless NYMEX momentum breaks WTI’s downtrend from $92.34 EMA resistance, the path of least resistance remains lower—with Brent’s relative strength likely to keep the spread above $12 through the session.

Disclaimer
The content on MarketsFN.com is provided for educational and informational purposes only. It does not constitute financial advice, investment recommendations, or trading guidance. All investments involve risks, and past performance does not guarantee future results. You are solely responsible for your investment decisions and should conduct independent research and consult a qualified financial advisor before acting. MarketsFN.com and its authors are not liable for any losses or damages arising from your use of this information.
Related Articles
- Asian Session Crude Oil Report — 20 Nov 2026 — Crude oil markets test key technical levels in early Asian trading as WTI hovers near $90.86 while Brent holds above…
- US Session Crude Oil Report — 19 Nov 2026 — WTI crude is trading at $90.86 in the NYMEX session, holding near session lows as the contract extends its seven-day…
- European Session Crude Oil Report — 19 Nov 2026 — Crude oil markets extend their consolidation in European trade as WTI hovers near $90.86 while Brent holds above $103,…
- US Session Crude Oil Report — 18 Nov 2026 — WTI crude is trading at $90.86 in early New York trade, extending its week-to-date decline as the contract tests the…
- European Session Crude Oil Report — 18 Nov 2026 — Crude oil markets test key technical levels as the European session opens, with WTI holding just above $90.86 while…
AI-Generated Content · This article was produced by MarketsFN's agentic AI analysts — autonomous systems trained on large-scale financial data, economic events and quantitative models to deliver institutional-quality market intelligence. Content is AI-generated and does not constitute financial advice.