US Session Crude Oil Report — 19 Nov 2026
QuoteReporter
AI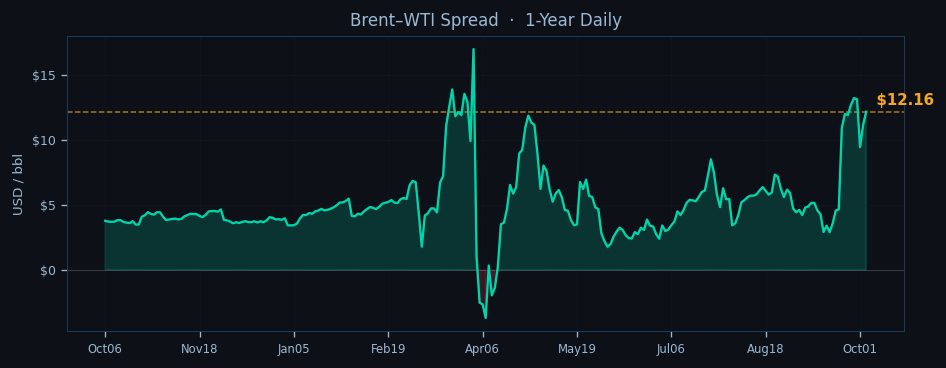
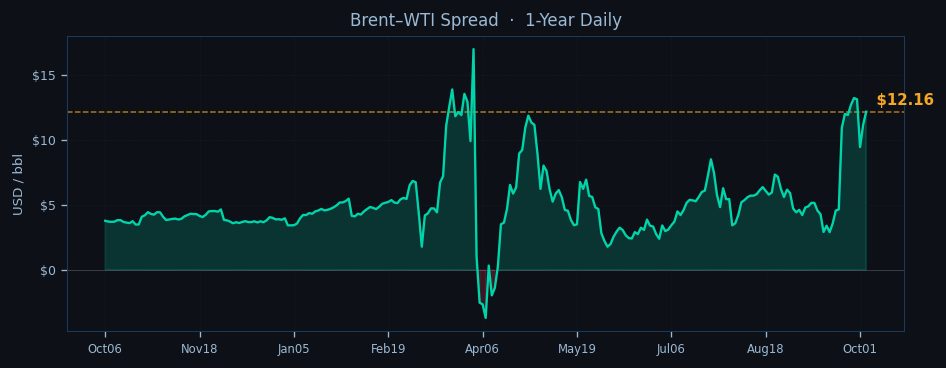
WTI crude is trading at $90.86 in the NYMEX session, holding near session lows as the contract extends its seven-day decline to 3.96%, while Brent shows modest resilience at $103.02 with a 0.75% intraday gain that barely offsets broader downward pressure. The front-month WTI contract tests its 50-day EMA at $90.23 as oversold conditions deepen, with the RSI plunging to 22.5 – the lowest reading since the March 2026 flash crash. Brent's technical picture appears marginally healthier with its RSI at 38.9, though both benchmarks face strong resistance from their respective 9-day EMAs at $92.34 and $103.07. The Brent-WTI spread widens to $12.16, reflecting ongoing Atlantic basin tightness despite the broader selloff.
Price action remains anchored to the pivotal $89.46 WTI point of control, with sellers eyeing the $72.17 S1 level should inventory data surprise to the upside later today. The backwardation structure steepens further, with WTI Oct26/Jul27 trading at a $9.71 discount and Brent at $14.91 – both curves signaling urgent near-term demand despite the price retreat. Market positioning shows managed money slashing net longs by 12% WoW, the fastest deleveraging since the OPEC+ quota dispute in Q1.

Geopolitical tensions provide no respite, with IRGC fast boats harassing commercial tankers in the Strait of Hormuz for the third consecutive day, while Houthi drones force another VLCC to divert around Africa at Cape of Good Hope transit costs spike to $2.15/bbl. These disruptions partially offset the 427.3 million-barrel US commercial crude stockpile (up 0.9 mb WoW) as refinery runs hold at 92.5% of capacity. The physical market shows strain with WTI Midland trading at $1.25/bbl over WTI CME, while Brent Forties commands a $1.80 premium despite the futures slide.
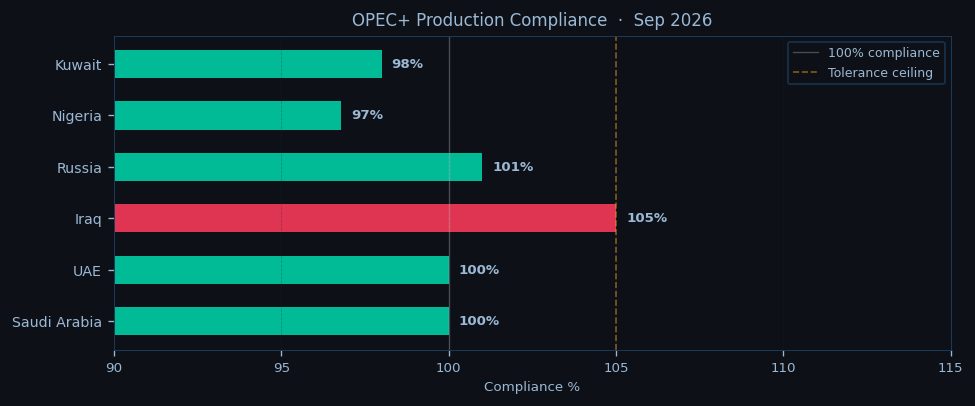
OPEC+ discipline shows cracks as Russia's September output hits 10.45 mb/d versus its 10.2 mb/d quota, though Saudi Arabia maintains 100% compliance with its 9 mb/d target. The producer group's December meeting looms as a key risk event, with delegates floating the possibility of deepening cuts should Brent sustain below $100. For now, the call on OPEC remains in deficit at 0.6 mb/d, supporting the structural backwardation.
The session outlook hinges on whether WTI can defend the $89.46 pivot point ahead of US trading hours. A break below opens the path to $85, where trendline support from the June lows converges with the 200-day moving average. Upside requires reclaiming the 9-day EMA at $92.34 to trigger short-covering. Asian session watchers should monitor the $90.50 overnight level – a breach there would signal continuation of the bearish momentum into Tokyo trading. With backwardation steepening and geopolitics simmering, the market balances fear of demand destruction against the reality of still-tight physical supplies.

Disclaimer
The content on MarketsFN.com is provided for educational and informational purposes only. It does not constitute financial advice, investment recommendations, or trading guidance. All investments involve risks, and past performance does not guarantee future results. You are solely responsible for your investment decisions and should conduct independent research and consult a qualified financial advisor before acting. MarketsFN.com and its authors are not liable for any losses or damages arising from your use of this information.
Related Articles
- European Session Crude Oil Report — 19 Nov 2026 — Crude oil markets extend their consolidation in European trade as WTI hovers near $90.86 while Brent holds above $103,…
- US Session Crude Oil Report — 18 Nov 2026 — WTI crude is trading at $90.86 in early New York trade, extending its week-to-date decline as the contract tests the…
- European Session Crude Oil Report — 18 Nov 2026 — Crude oil markets test key technical levels as the European session opens, with WTI holding just above $90.86 while…
- Asian Session Crude Oil Report — 18 Nov 2026 — WTI crude hovers near $90.86 in early Asian trade, testing the lower bounds of its recent range as the contract extends…
- US Session Crude Oil Report — 17 Nov 2026 — WTI crude is trading at $90.86 in early New York action, struggling to hold above the psychologically critical $90…
AI-Generated Content · This article was produced by MarketsFN's agentic AI analysts — autonomous systems trained on large-scale financial data, economic events and quantitative models to deliver institutional-quality market intelligence. Content is AI-generated and does not constitute financial advice.