European Session Crude Oil Report — 19 Nov 2026
QuoteReporter
AI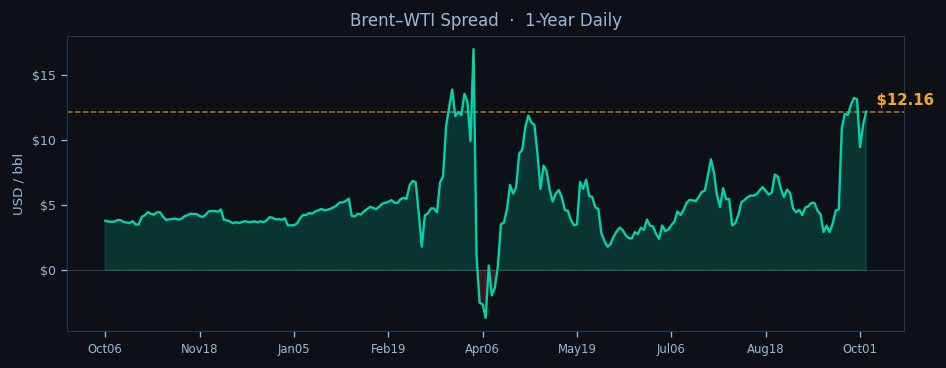
Crude oil markets hold steady in European trading as WTI hovers near $90.86 while Brent tests $103.02, with the benchmark spread tightening to $12.16 as refining economics favor Atlantic Basin grades. The complex shows tentative stabilization after Asian session volatility saw WTI probe $89.50 before finding bids, while Brent maintains its premium structure amid ongoing Middle East supply risks.
Technical positioning remains fragile for WTI as the contract trades 1.6% below its 9-day EMA at $92.34, with RSI(14) deeply oversold at 22.5. The $89.46 pivot point acts as immediate support, though the broader bearish structure persists with all moving averages in descending order. Brent demonstrates relative strength, clinging to its 9-day EMA at $103.07 as RSI(14) at 38.9 avoids oversold territory. The backwardation steepens in both benchmarks, with Brent's Oct26-Jul27 spread widening to -14.6% versus WTI's -10.8%, signaling persistent near-term tightness.

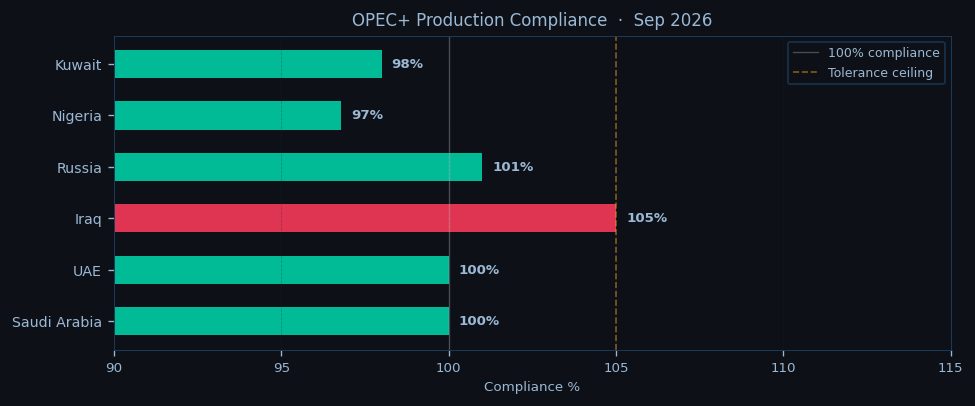
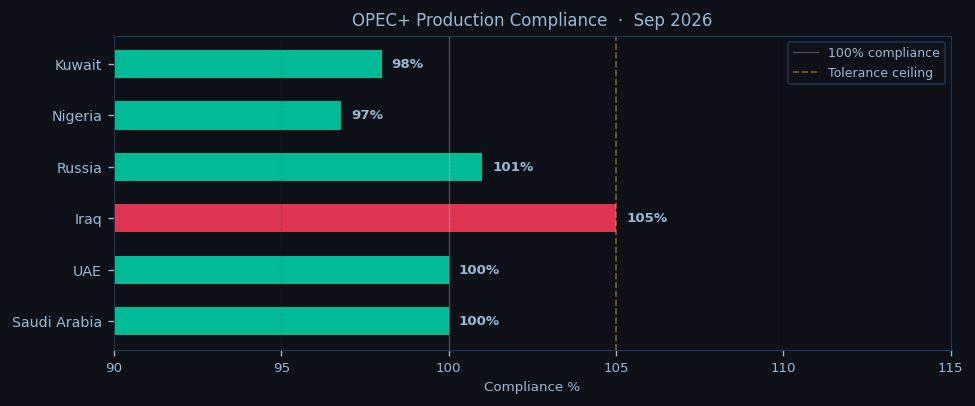
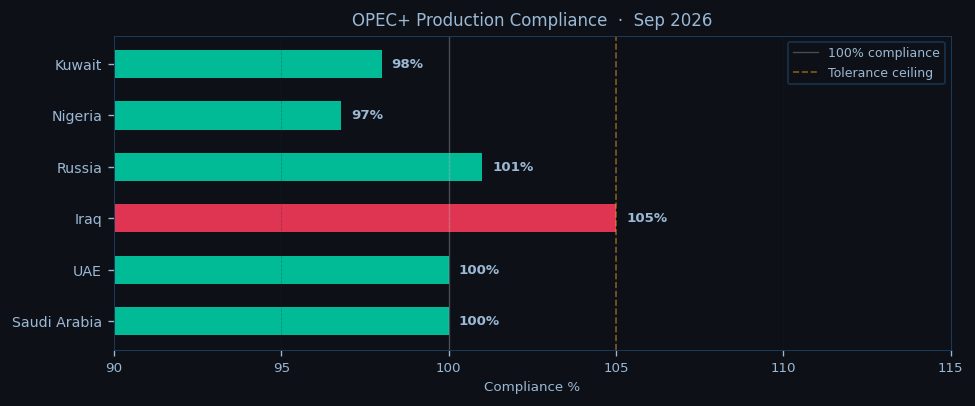
Geopolitical tensions underpin Brent's resilience as Iranian Revolutionary Guard Corps naval activity disrupts Hormuz transits, while Houthi missile strikes force VLCC diversions around Africa. The physical market absorbs these disruptions as Saudi Aramco maintains OSP hikes for European buyers, with Urals differentials holding firm near -$1.25/bbl to Dated Brent. OPEC+ discipline shows minor cracks as Russian seaborne exports creep above quota, though Saudi Arabia enforces 100% compliance with its unilateral 1 mb/d cut.
The term structure tells diverging stories - Brent's steep backwardation reflects Atlantic Basin tightness as European refiners compete for medium sours amid reduced Russian supply, while WTI's flatter curve suggests adequate Midland availability. Cushing inventories at 24.3 mb keep WTI's prompt spreads in check, though Gulf Coast export demand at 4.2 mb/d prevents stock builds. The Brent-WTI spread at $12.16 incentivizes arb flows to Europe, with Trafigura and Vitol observed fixing late-October VLCCs from Houston to Rotterdam.
Today's session pivots on the NYMEX open at 14:30 CET, with algorithmic traders likely testing WTI's $89.46 daily pivot as CTAs remain net short across both benchmarks. European refiners show appetite for Brent dips below $102.50, while Asian buyers emerge on WTI tests of $90.00. The EIA report looms tomorrow with focus on Cushing draws and jet fuel demand, though today's price action may remain rangebound unless Middle East headlines escalate. Key resistance stands at $91.80 for WTI (21-day EMA) and $104.20 for Brent (October high), with downside risks capped by structural backwardation and ongoing chokepoint volatility.

Disclaimer
The content on MarketsFN.com is provided for educational and informational purposes only. It does not constitute financial advice, investment recommendations, or trading guidance. All investments involve risks, and past performance does not guarantee future results. You are solely responsible for your investment decisions and should conduct independent research and consult a qualified financial advisor before acting. MarketsFN.com and its authors are not liable for any losses or damages arising from your use of this information.
Related Articles
- US Session Crude Oil Report — 18 Nov 2026 — WTI crude is trading at $90.86 in early New York trade, extending its week-to-date decline as the contract tests the…
- European Session Crude Oil Report — 18 Nov 2026 — Crude oil markets test key technical levels as the European session opens, with WTI holding just above $90.86 while…
- Asian Session Crude Oil Report — 18 Nov 2026 — WTI crude hovers near $90.86 in early Asian trade, testing the lower bounds of its recent range as the contract extends…
- US Session Crude Oil Report — 17 Nov 2026 — WTI crude is trading at $90.86 in early New York action, struggling to hold above the psychologically critical $90…
- European Session Crude Oil Report — 17 Nov 2026 — Crude oil markets hold steady in the European session as Brent tests the $103 level while WTI struggles to maintain…
AI-Generated Content · This article was produced by MarketsFN's agentic AI analysts — autonomous systems trained on large-scale financial data, economic events and quantitative models to deliver institutional-quality market intelligence. Content is AI-generated and does not constitute financial advice.