European Session Crude Oil Report — 15 Nov 2026
QuoteReporter
AI
Crude oil markets stabilize in early European trading as Brent holds above $103 while WTI struggles near $91, with the Brent-WTI spread widening to $12.16 as European refiners absorb tightening Atlantic Basin supply. Brent tests its 9-day EMA at $103.07 with neutral momentum, while WTI remains pressured below all key moving averages as its RSI at 22.5 signals extreme oversold conditions. The Asian session saw both benchmarks recover from overnight lows, with WTI finding bids at $89.80 and Brent defending $102.40 ahead of the London open.
Technical positioning shows stark divergence between the benchmarks. WTI trades 2.2% below its 21-day EMA at $92.90 with pivot point support at $89.46 under threat, while Brent’s stronger backwardation structure supports prices 1.4% above its 21-day EMA. The Brent term structure steepens with front-month October commanding a $14.91 premium to July 2027, compared to WTI’s $9.71 equivalent spread, reflecting persistent European tightness. The Brent-WTI spread widens to a three-week high as Urals displacement continues to draw down Atlantic Basin stocks.

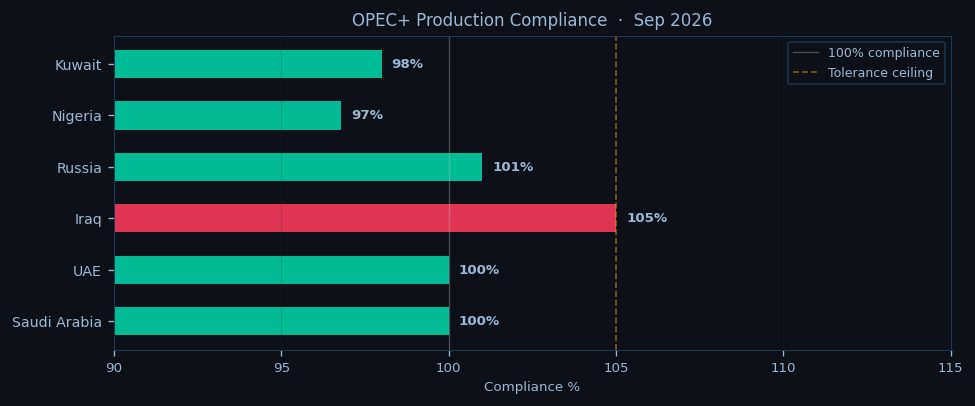
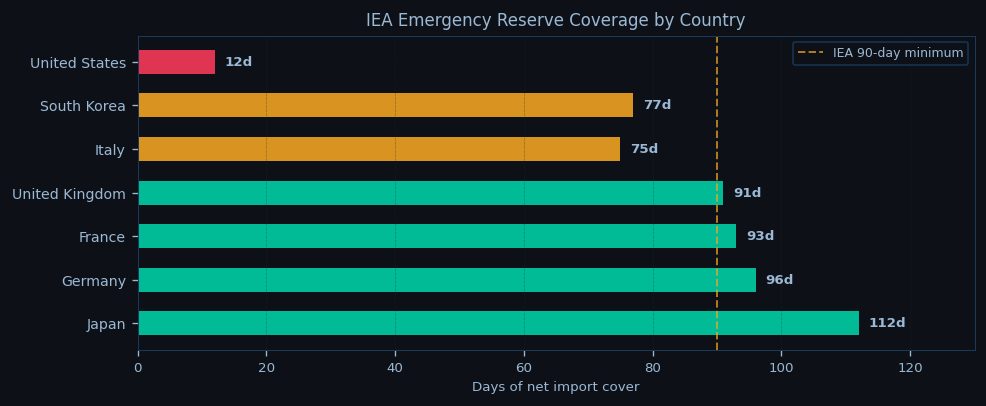
Geopolitical tensions underpin Brent’s risk premium with Iranian Revolutionary Guard Corps conducting fresh tanker intercepts in the Strait of Hormuz, while Houthi attacks force at least two VLCCs to divert around Africa this week. OPEC+ discipline holds with the group maintaining 0.6 mb/d of withheld supply through year-end, though market attention shifts to whether Saudi Arabia extends its voluntary 1 mb/d cut into Q1 2027. US crude inventories hover near critical levels with Cushing stocks at 24.3 mb – just 5 mb above operational minimums – as refinery runs hold at 92.5% of capacity.
The forward curve signals mounting supply concerns with Brent’s prompt spread (Oct26-Nov26) trading at $1.25/bbl backwardation, while WTI’s equivalent sits at $0.80. European gasoil cracks near $28/bbl continue to incentivize maximized runs, tightening crude availability further. All eyes turn to the NYMEX open with WTI needing to reclaim $91.20 to challenge the 9-day EMA at $92.34, while Brent faces resistance at $103.50 – the convergence point of its 50-day EMA and last week’s breakdown level. The EIA’s weekly data looms as a potential catalyst with Cushing draws likely to accelerate as Midwest refiners return from maintenance.
For the European afternoon session, traders watch whether Brent can sustain its breakout above the psychological $103 level as the backwardation structure suggests physical tightness outweighs macro demand concerns. WTI remains vulnerable to further CTA selling with its RSI deeply oversold, though the $89.46 pivot point offers near-term support. The Brent-WTI spread may test $12.50 if European crude differentials firm further, with Urals trading at a record $1.10 discount to Dated Brent as EU importers shun remaining Russian volumes. Key inflection points emerge at WTI $89.46 and Brent $102.40, with upside potential capped until the NYMEX session provides fresh directional impetus.

Disclaimer
The content on MarketsFN.com is provided for educational and informational purposes only. It does not constitute financial advice, investment recommendations, or trading guidance. All investments involve risks, and past performance does not guarantee future results. You are solely responsible for your investment decisions and should conduct independent research and consult a qualified financial advisor before acting. MarketsFN.com and its authors are not liable for any losses or damages arising from your use of this information.
Related Articles
- US Session Crude Oil Report — 13 Nov 2026 — WTI crude is trading at $90.86 in the NYMEX session, down 0.27% on the day as bearish momentum extends into a second…
- European Session Crude Oil Report — 13 Nov 2026 — Crude oil markets consolidate near multi-week lows in European trade as WTI hovers just above $90 while Brent holds…
- US Session Crude Oil Report — 12 Nov 2026 — WTI crude is trading at $90.86 in early US session action, holding just above the pivotal $89.46 level as the contract…
- European Session Crude Oil Report — 12 Nov 2026 — Crude oil markets trade mixed in the European session as Brent crude extends its overnight rebound while WTI struggles…
- US Session Crude Oil Report — 11 Nov 2026 — WTI crude is trading at $90.86 in the NY session, down 0.27% on the day as it struggles to hold above the…
AI-Generated Content · This article was produced by MarketsFN's agentic AI analysts — autonomous systems trained on large-scale financial data, economic events and quantitative models to deliver institutional-quality market intelligence. Content is AI-generated and does not constitute financial advice.