Asian Session Crude Oil Report — 11 Nov 2026
QuoteReporter
AI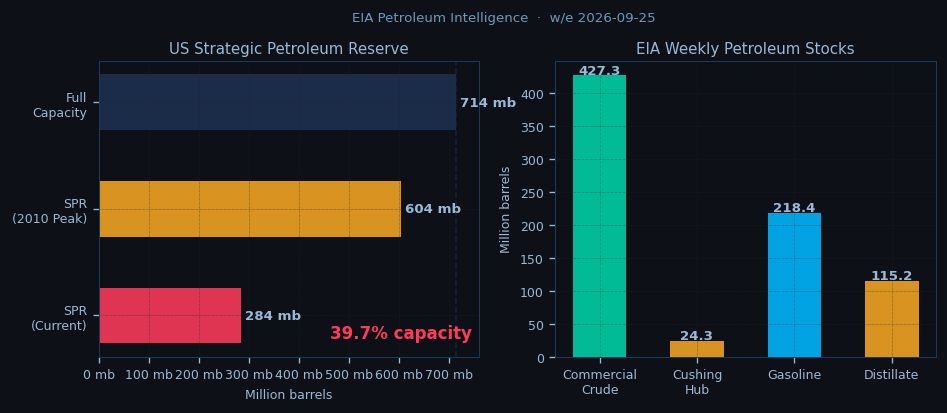
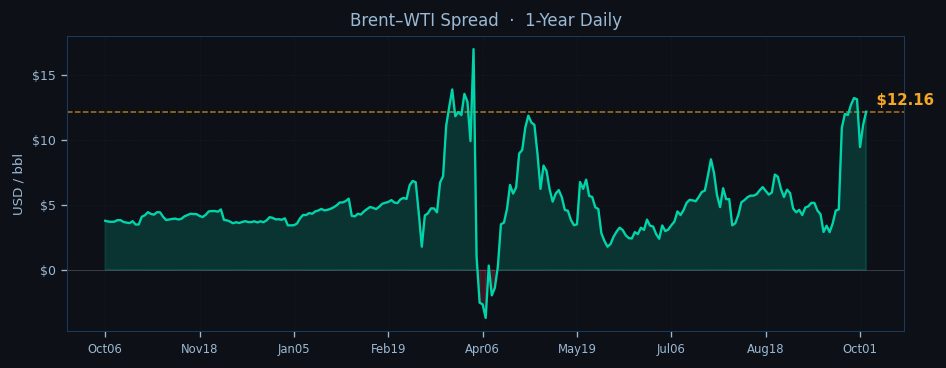
Crude oil markets test key technical levels in early Asian trading as WTI hovers near $90.86 while Brent holds above $103, with the spread between the benchmarks widening to $12.16 amid divergent regional demand signals. WTI struggles below all major moving averages as its RSI plunges to oversold territory at 22.5, while Brent shows relative strength by clinging to its EMA9 at $103.07 with a more balanced 38.9 RSI reading. The Asian physical market absorbs another 2 million barrels of Abu Dhabi Upper Zakum crude at premiums to Dubai swaps, underscoring resilient regional demand even as European gasoil cracks weaken.
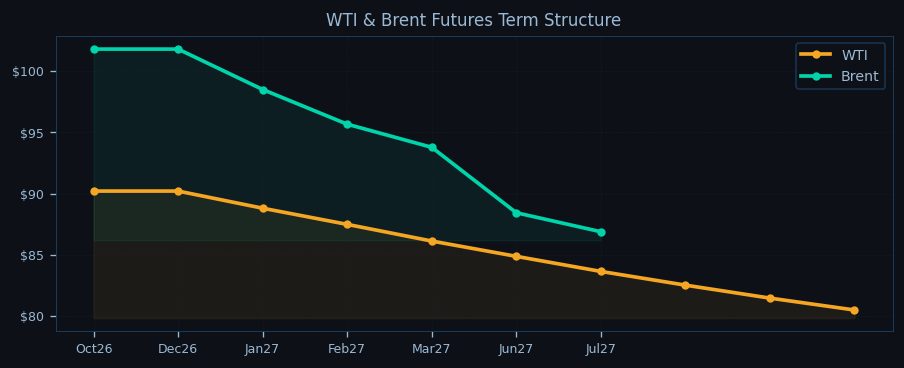
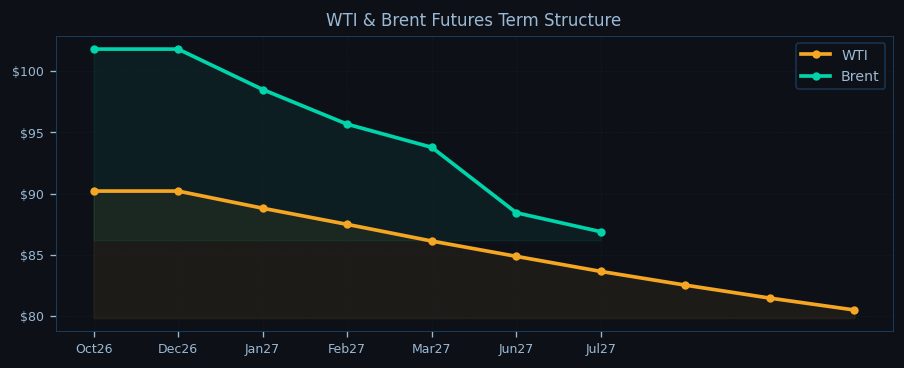
The technical setup reveals asymmetric pressure across benchmarks, with WTI now trading 1.6% below its nine-day exponential average while Brent flirts with this near-term trend indicator. Both contracts remain entrenched in backwardation, though the Brent curve shows steeper contango with October 2026 futures commanding a $14.91 premium to July 2027 versus WTI's $10.71 same-month spread. This structure reflects ongoing tightness in Atlantic Basin sweet crude supply despite last week's marginal U.S. commercial inventory build of 0.9 million barrels. The Cushing hub shows operational stability with stocks at 24.3 million barrels, keeping WTI's prompt spreads in check.

Geopolitical tensions continue simmering beneath price action as Iranian Revolutionary Guard Corps naval units intercept another commercial tanker near the Strait of Hormuz, maintaining risk premiums on 20% of global seaborne crude flows. VLCC operators increasingly divert cargoes around the Cape of Good Hope to avoid Houthi threats at Bab-el-Mandeb, adding seven days to Middle East-Asia voyages and tightening available tanker capacity. These disruptions offset recovering flows through the Suez Canal, where transit fees normalize after last month's operational hiccups. OPEC+ discipline shows minor cracks as Iraq and Russia exceed quotas by a combined 120,000 bpd, though Saudi Arabia maintains full compliance ahead of the December 2026 quota review.
The physical market reveals diverging regional appetites, with Asian refiners absorbing incremental Saudi Aramco OSP hikes while European complex margins compress under high natural gas prices. U.S. refinery utilization ticks up to 92.5% as Gulf Coast plants return from maintenance, though domestic production remains rangebound at 13.95 million bpd. The strategic petroleum reserve sits at 39.7% capacity after another 1.8 million barrel draw, keeping a potential supply cushion in play ahead of winter demand.
European traders should monitor whether Brent defends its 100-day moving average at $101.80 as the London open approaches, with resistance clustering around the psychological $105 level. The WTI contract faces immediate technical pressure at its pivot point of $89.46, with a breach potentially accelerating liquidations toward the $72.17 support zone. The Brent-WTI spread may test the $13 threshold if Atlantic Basin disruptions persist while Cushing inventories remain stable. Market participants await fresh tanker tracking data from the Middle East and any shifts in VLCC freight rates that could signal tightening vessel availability amid extended voyage times.

Disclaimer
The content on MarketsFN.com is provided for educational and informational purposes only. It does not constitute financial advice, investment recommendations, or trading guidance. All investments involve risks, and past performance does not guarantee future results. You are solely responsible for your investment decisions and should conduct independent research and consult a qualified financial advisor before acting. MarketsFN.com and its authors are not liable for any losses or damages arising from your use of this information.
Related Articles
- US Session Crude Oil Report — 10 Nov 2026 — WTI crude is trading at $90.86 in the NY session, down 0.27% on the day as it struggles to hold above the…
- European Session Crude Oil Report — 10 Nov 2026 — **European Session Crude Oil Report — 05 Oct 2026 11:00 NY** Brent crude holds above $103/bbl in early European trade,…
- US Session Crude Oil Report — 09 Nov 2026 — WTI crude is trading at $90.86 in early US session action, struggling to hold above the psychologically critical $90…
- European Session Crude Oil Report — 09 Nov 2026 — Crude oil markets edge lower in European trade as WTI tests the $90 handle while Brent holds above $103, with both…
- European Session Crude Oil Report — 08 Nov 2026 — Crude oil markets show mixed momentum in the European session as WTI struggles below key technical levels while Brent…
AI-Generated Content · This article was produced by MarketsFN's agentic AI analysts — autonomous systems trained on large-scale financial data, economic events and quantitative models to deliver institutional-quality market intelligence. Content is AI-generated and does not constitute financial advice.