USD/TRY: Up 0.16% to 48.6376 — RSI Overbought
MarketsFN Team
USD/TRY: Up 0.16% to 48.6376 — RSI Overbought
Published: September 15, 2026 · MarketsFN Team · US Session · Emerging FX
| Pair | Rate | Change | RSI(14) | SMA-20 | SMA-50 | 52W High | 52W Low | Pivot | R1 | S1 |
|---|---|---|---|---|---|---|---|---|---|---|
| USD/TRY | 48.6376 | +0.16% | 83.0 | 48.2193 | 47.6808 | 48.6376 | 41.4702 | 48.5727 | 48.6082 | 48.5244 |
S/R Support & Resistance Levels
Dynamic Trendlines
| Level | Type | Direction | Distance |
|---|---|---|---|
| 48.3134 | 20d Support | up (ascending) | -0.67% / 3241.7 pips |
| 48.7094 | 20d Resistance | up (ascending) | +0.15% / 717.9 pips |
| 48.2859 | 50d Support | up (ascending) | -0.72% / 3516.5 pips |
| 48.7016 | 50d Resistance | up (ascending) | +0.13% / 640.4 pips |
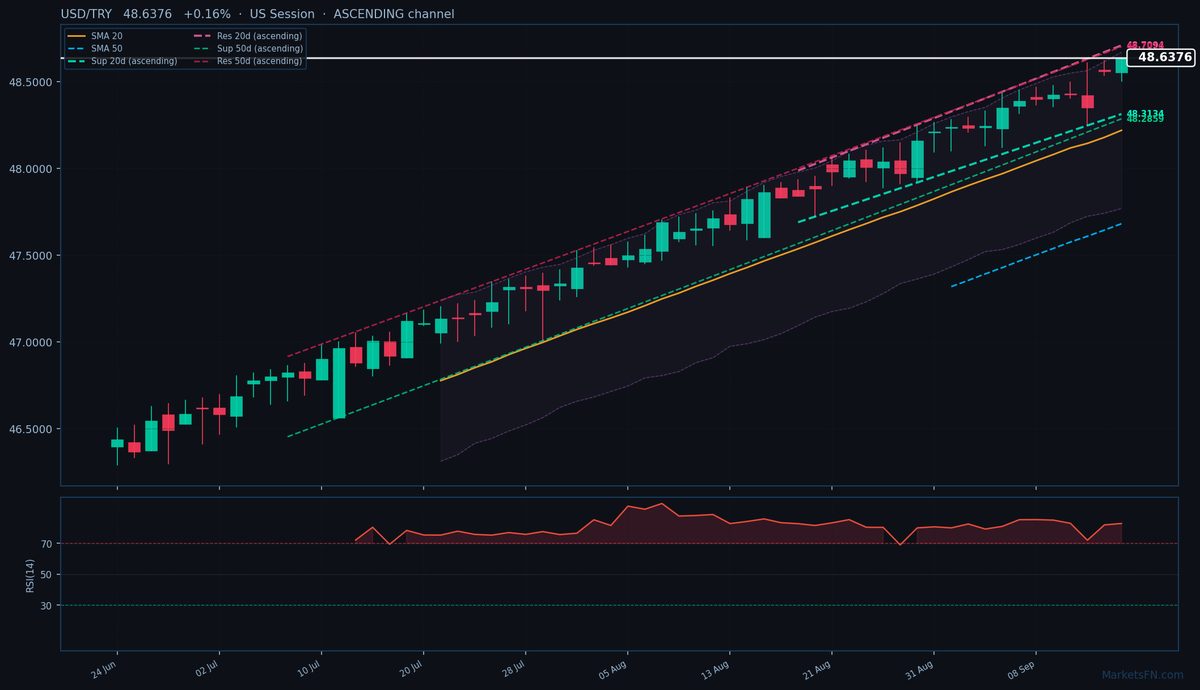
USD/TRY is trading at 48.6376 (+0.16%), pressing against its all-time high of 48.6376 as the lira’s structural weakness persists. The pair remains firmly in an uptrend, trading above both the 20-day SMA (48.2193) and 50-day SMA (47.6808), with the ascending dynamic channels confirming bullish momentum. The 20-day resistance trendline sits just 717.9 pips above at 48.7094 (+0.15%), while the 20-day support trendline lies 3241.7 pips below at 48.3134 (-0.67%). The 50-day channel mirrors this structure, with resistance at 48.7016 (+0.13%) and support at 48.2859 (-0.72%).
Static levels show immediate resistance at R1 (48.6082), just 293.4 pips away, while S1 (48.5244) offers minor support 1132.0 pips below. The RSI at 83.0 screams overbought, but in TRY’s case, extreme readings often persist due to chronic depreciation pressures. Today’s narrow 0.28% range (ATR 0.1945) suggests consolidation before another leg higher, particularly with the European session failing to trigger profit-taking.
The lira’s trajectory hinges on whether the CBRT intervenes near the psychological 49.00 level. A break above 48.7094 (20-day dynamic resistance) would signal continuation, while a reversal below 48.5244 (S1) might hint at temporary exhaustion. Watch for any unscheduled central bank action — the only near-term catalyst capable of disrupting this one-way trend.
Disclaimer
The content on MarketsFN.com is provided for educational and informational purposes only and does not constitute financial advice. All investments involve risk and past performance does not guarantee future results.