USD/THB: Up 0.11% to 33.7290 — Ascending Channel
MarketsFN Team
USD/THB: Up 0.11% to 33.7290 — Ascending Channel
Published: October 30, 2026 · MarketsFN Team · US Session · Emerging FX
| Pair | Rate | Change | RSI(14) | SMA-20 | SMA-50 | 52W High | 52W Low | Pivot | R1 | S1 |
|---|---|---|---|---|---|---|---|---|---|---|
| USD/THB | 33.7290 | +0.11% | 59.5 | 33.5707 | 33.2876 | 33.7470 | 30.5160 | 33.7057 | 33.7953 | 33.5803 |
S/R Support & Resistance Levels
Dynamic Trendlines
| Level | Type | Direction | Distance |
|---|---|---|---|
| 33.2204 | 20d Support | up (ascending) | -1.51% / 5085.9 pips |
| 33.8388 | 20d Resistance | flat (flat) | +0.33% / 1097.8 pips |
| 33.2337 | 50d Support | up (ascending) | -1.47% / 4953.2 pips |
| 34.0206 | 50d Resistance | up (ascending) | +0.86% / 2916.2 pips |
Static Levels
| Level | Type | Touches | Distance |
|---|---|---|---|
| 33.7045 | Resistance | 2x | +0.03% / 115.0 pips |
| 32.4945 | Support | 2x | -3.56% / 11985.0 pips |
| 32.4505 | Support | 2x | -3.69% / 12425.0 pips |
| 32.2535 | Support | 2x | -4.27% / 14395.0 pips |
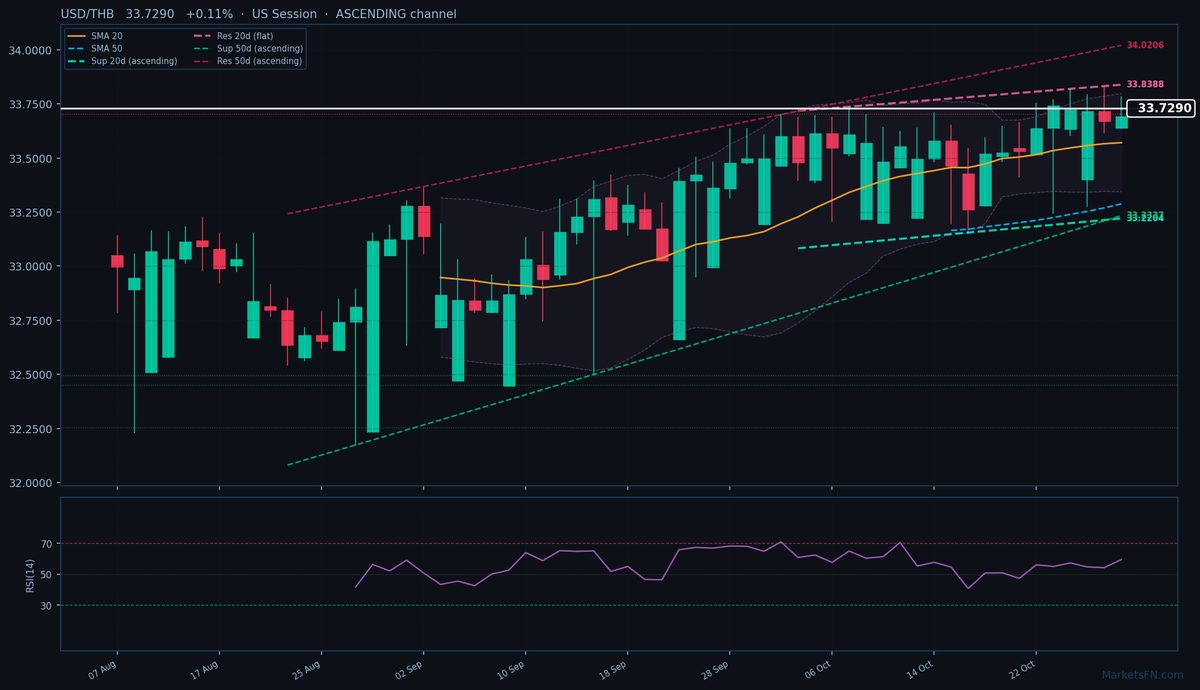
USD/THB is trading at 33.7290 (+0.11%), testing the upper bounds of its 52-week range (30.5160 – 33.7470) as the pair consolidates near all-time highs. The uptrend remains intact with price action firmly above both the 20-day (33.5707) and 50-day (33.2876) SMAs, though today's narrow 0.42% range (33.6380 – 33.7810) suggests hesitation after yesterday's breakout above the previous 52-week high of 33.7470. The ascending 20-day dynamic channel (support at 33.2204, resistance at 33.8388) leaves just 1097.8 pips to overhead resistance, while the 50-day channel shows a steeper ascent with resistance at 34.0206 (2916.2 pips away).
Static levels reveal thin nearby resistance at R1 33.7045 (115.0 pips below current), but the closest meaningful support cluster sits far lower at S1 32.4945 (11985.0 pips away) – a structural vulnerability if profit-taking emerges. RSI at 59.5 shows neutral momentum, neither overbought nor oversold, allowing room for further upside. The immediate test is whether USD/THB can sustain above the 33.7470 previous high, which would open a path toward the 50-day dynamic resistance at 34.0206. Failure here could see a retest of the 20-day SMA at 33.5707. With the European session failing to extend gains beyond 33.7810, watch for either a breakout above 33.8388 or a rejection that traps late longs. The next 24 hours will confirm whether this is consolidation before another leg higher or exhaustion at record levels.
Disclaimer
The content on MarketsFN.com is provided for educational and informational purposes only and does not constitute financial advice. All investments involve risk and past performance does not guarantee future results.