USD/SGD: Down 0.15% to 1.2782 — Price Below SMA-20
MarketsFN Team
USD/SGD: Down 0.15% to 1.2782 — Price Below SMA-20
Published: October 30, 2026 · MarketsFN Team · US Session · Emerging FX
| Pair | Rate | Change | RSI(14) | SMA-20 | SMA-50 | 52W High | 52W Low | Pivot | R1 | S1 |
|---|---|---|---|---|---|---|---|---|---|---|
| USD/SGD | 1.2782 | -0.15% | 51.8 | 1.2792 | 1.2748 | 1.3075 | 1.2595 | 1.2812 | 1.2832 | 1.2788 |
S/R Support & Resistance Levels
Dynamic Trendlines
| Level | Type | Direction | Distance |
|---|---|---|---|
| 1.2753 | 20d Support | flat (flat) | -0.23% / 29.1 pips |
| 1.2840 | 20d Resistance | down (descending) | +0.45% / 58.0 pips |
| 1.2771 | 50d Support | up (ascending) | -0.09% / 11.3 pips |
| 1.2910 | 50d Resistance | up (ascending) | +1.00% / 128.0 pips |
Static Levels
| Level | Type | Touches | Distance |
|---|---|---|---|
| 1.2936 | Resistance | 2x | +1.06% / 135.4 pips |
| 1.2840 | Resistance | 2x | +0.31% / 39.9 pips |
| 1.2810 | Resistance | 2x | +0.07% / 9.4 pips |
| 1.2788 | Support | 2x | -0.10% / 12.8 pips |
| 1.2754 | Support | 2x | -0.36% / 46.3 pips |
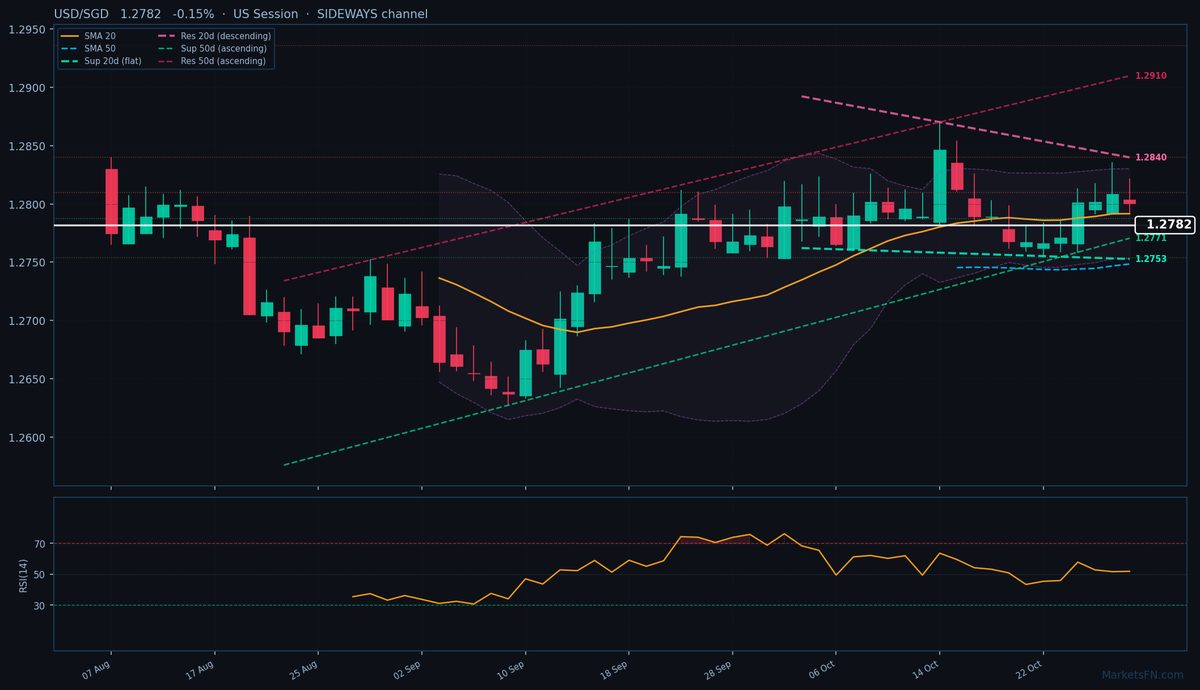
USD/SGD is trading at 1.2782 (-0.15%), testing the lower bounds of a consolidation phase as it flirts with the 20-day SMA at 1.2792 while holding above the 50-day SMA at 1.2748. This squeeze between moving averages reflects indecision, with the pair trapped in a 29-pip range from the 20-day dynamic support at 1.2753 (flat channel) to descending resistance at 1.2840. The broader 50-day channel remains ascending, however, with dynamic support rising to 1.2771 (just 11 pips below spot) and resistance climbing to 1.2910. Immediate static levels frame the action tightly: S1 at 1.2788 (13 pips below) and R1 at 1.2810 (9 pips above) form a 22-pip battleground that’s been tested twice at each level.
RSI at 51.8 confirms neutral momentum, though the break below the 20-day SMA and proximity to the 50-day dynamic support suggests bearish pressure may be building. ATR’s 36-pip daily range implies limited breakout potential near-term, but watch for a close below 1.2771 (50-day dynamic support) to confirm downside targeting 1.2754 static support (46 pips down). Conversely, reclaiming 1.2810 (R1) opens a path to test 1.2840 resistance (58 pips up), where the descending 20-day dynamic trendline converges with static R2. The European session’s tepid range (1.2793–1.2821) hints at hesitation—tomorrow’s Asian open could force a directional commitment if liquidity pushes beyond either static pivot cluster.
Disclaimer
The content on MarketsFN.com is provided for educational and informational purposes only and does not constitute financial advice. All investments involve risk and past performance does not guarantee future results.