USD/THB: Down 0.07% to 33.2600 — Ascending Channel
MarketsFN Team
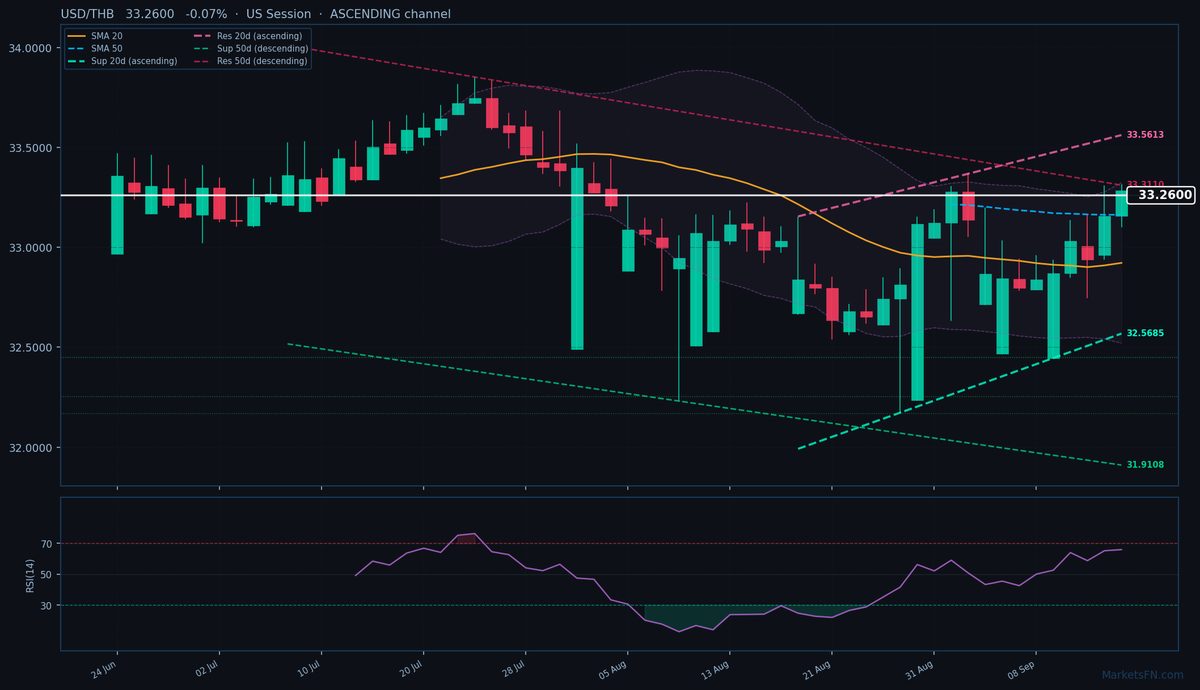
USD/THB: Down 0.07% to 33.2600 — Ascending Channel
Published: September 16, 2026 · MarketsFN Team · US Session · Emerging FX
| Pair | Rate | Change | RSI(14) | SMA-20 | SMA-50 | 52W High | 52W Low | Pivot | R1 | S1 |
|---|---|---|---|---|---|---|---|---|---|---|
| USD/THB | 33.2600 | -0.07% | 66.0 | 32.9220 | 33.1629 | 33.7470 | 30.5160 | 33.1347 | 33.3293 | 32.9623 |
S/R Support & Resistance Levels
Dynamic Trendlines
| Level | Type | Direction | Distance |
|---|---|---|---|
| 32.5685 | 20d Support | up (ascending) | -2.08% / 6915.2 pips |
| 33.5613 | 20d Resistance | up (ascending) | +0.91% / 3013.0 pips |
| 31.9108 | 50d Support | down (descending) | -4.06% / 13491.7 pips |
| 33.3110 | 50d Resistance | down (descending) | +0.15% / 510.0 pips |
Static Levels
| Level | Type | Touches | Distance |
|---|---|---|---|
| 32.4505 | Support | 2x | -2.50% / 8325.0 pips |
| 32.2535 | Support | 2x | -3.09% / 10295.0 pips |
| 32.1695 | Support | 2x | -3.35% / 11135.0 pips |
USD/THB is trading at 33.2600 (-0.07%), hovering near the top of its 52-week range (30.5160 – 33.7470) as the pair consolidates after a strong uptrend. The price remains firmly above both the 20-day SMA (32.9220) and 50-day SMA (33.1629), confirming bullish momentum, though the 50-day dynamic resistance trendline at 33.3110 (just 510 pips above) is capping gains today. The 20-day dynamic channel is ascending, with support at 32.5685 (6915 pips below) and resistance at 33.5613 (3013 pips above), suggesting room for further upside if the pair breaks through near-term resistance.
Static levels show immediate support at S1 (32.9623, 2977 pips below) and resistance at R1 (33.3293, 693 pips above), with today’s high testing the latter. The RSI at 66.0 sits in neutral territory, neither overbought nor oversold, allowing for continued trend extension. However, the descending 50-day dynamic resistance trendline (33.3110) aligns with today’s high, creating a clear technical hurdle. A break above 33.3110 could target the 20-day dynamic resistance at 33.5613, while failure here may see a pullback toward the 20-day SMA (32.9220).
Short-term, the ascending 20-day channel favors bulls, but the conflicting 50-day descending resistance warns of potential consolidation. Watch for a decisive break above 33.3110 to confirm continuation, or a rejection toward S1 (32.9623) if momentum stalls. The European session’s price action near R1 will set the tone for the day.
Disclaimer
The content on MarketsFN.com is provided for educational and informational purposes only and does not constitute financial advice. All investments involve risk and past performance does not guarantee future results.