USD/CHF: Down 0.01% to 0.8239 — Descending Channel
MarketsFN Team
USD/CHF: Down 0.01% to 0.8239 — Descending Channel
Published: October 30, 2026 · MarketsFN Team · US Session
| Pair | Rate | Change | RSI(14) | SMA-20 | SMA-50 | 52W High | 52W Low | Pivot | R1 | S1 |
|---|---|---|---|---|---|---|---|---|---|---|
| USD/CHF | 0.8239 | -0.01% | 36.5 | 0.8280 | 0.8215 | 0.8356 | 0.7609 | 0.8258 | 0.8278 | 0.8220 |
📊 Support & Resistance Levels
Dynamic Trendlines
| Level | Type | Direction | Distance |
|---|---|---|---|
| 0.8152 | 20d Support | ↘ descending | -1.06% / 87.3 pips |
| 0.8296 | 20d Resistance | ↘ descending | +0.69% / 57.2 pips |
| 0.8193 | 50d Support | ↗ ascending | -0.56% / 46.0 pips |
| 0.8540 | 50d Resistance | ↗ ascending | +3.66% / 301.5 pips |
Static Levels
| Level | Type | Touches | Distance |
|---|---|---|---|
| 0.7924 | Support | 2× | -3.87% / 318.8 pips |
| 0.7904 | Support | 2× | -4.12% / 339.4 pips |
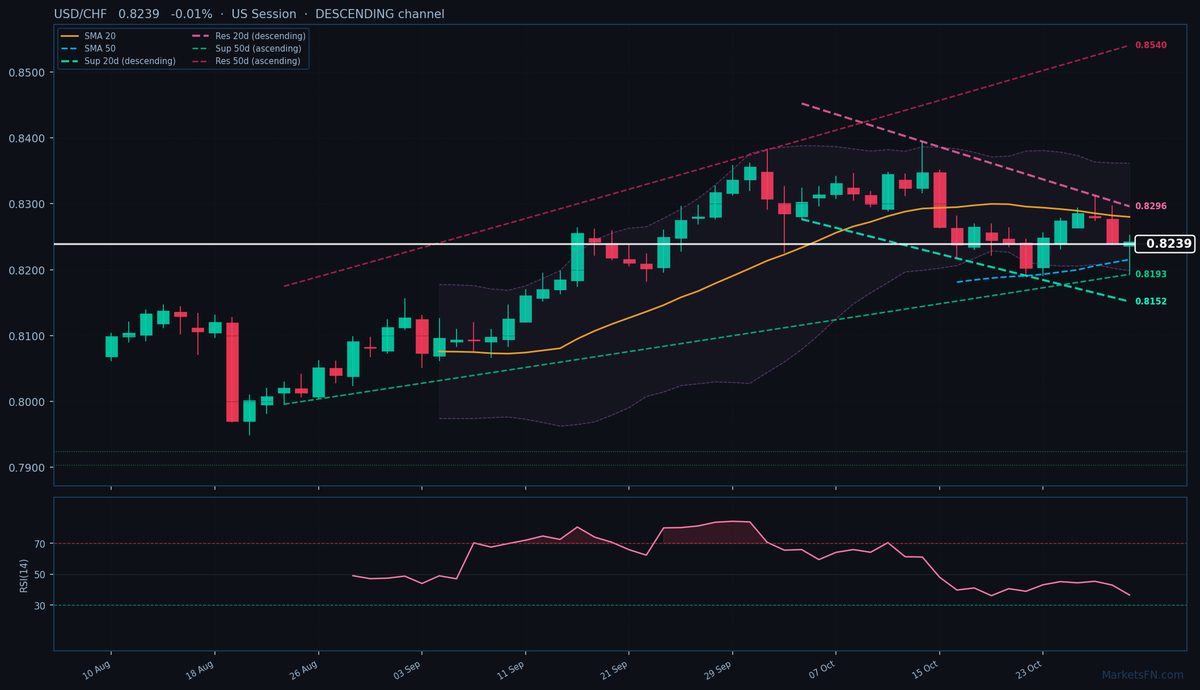
USD/CHF is trading at 0.8239 (-0.01%), caught in a consolidation phase between its SMA-20 (0.8280, 41.1 pips above) and SMA-50 (0.8215, 24.4 pips below). The pair is testing the lower bounds of its descending 20-day channel, with dynamic resistance at 0.8296 (+57.2 pips) and support at 0.8152 (-87.3 pips). The broader 50-day channel remains ascending, however, with resistance far above at 0.8540 (+301.5 pips) and near-term support at 0.8193 (-46.0 pips). This divergence between short-term bearish and medium-term bullish channels suggests indecision, compounded by an RSI(14) of 36.5 hovering near neutral territory.
The immediate static pivot at 0.8258 (+19.9 pips) and R1 at 0.8278 (+39.9 pips) loom as overhead resistance, while S1 at 0.8220 (-19.9 pips) offers minor support. Notably, stronger static supports at 0.7924 and 0.7904 are too distant (-318.8 pips and -339.4 pips) to matter today. With the ATR(14) at 0.0052, today’s range-bound action aligns with recent volatility.
Short-term, the pair’s failure to reclaim the SMA-20 keeps pressure on the downside, but the ascending 50-day channel and SMA-50 below suggest dip-buying interest. A break below 0.8193 (50-day dynamic support) would confirm bearish momentum, while a close above 0.8258 (pivot) could signal a retest of the 20-day dynamic resistance. The US session’s price action relative to these levels will dictate near-term direction. Watch for a decisive break of the 0.8193–0.8258 range to resolve the consolidation.
Disclaimer
The content on MarketsFN.com is provided for educational and informational purposes only and does not constitute financial advice. All investments involve risk and past performance does not guarantee future results.