USD/JPY: Up 0.53% to 155.21 — Descending Channel
MarketsFN Team
USD/JPY: Up 0.53% to 155.21 — Descending Channel
Published: September 16, 2026 · MarketsFN Team · US Session
| Pair | Rate | Change | RSI(14) | SMA-20 | SMA-50 | 52W High | 52W Low | Pivot | R1 | S1 |
|---|---|---|---|---|---|---|---|---|---|---|
| USD/JPY | 155.21 | +0.53% | 34.8 | 157.11 | 159.40 | 163.86 | 147.08 | 154.67 | 154.93 | 154.12 |
📊 Support & Resistance Levels
Dynamic Trendlines
| Level | Type | Direction | Distance |
|---|---|---|---|
| 150.52 | 20d Support | ↘ descending | -3.02% / 468.9 pips |
| 156.69 | 20d Resistance | ↘ descending | +0.95% / 147.6 pips |
| 152.36 | 50d Support | ↘ descending | -1.84% / 285.0 pips |
| 159.00 | 50d Resistance | ↘ descending | +2.45% / 379.6 pips |
Static Levels
| Level | Type | Touches | Distance |
|---|---|---|---|
| 159.80 | Resistance | 2× | +2.96% / 458.7 pips |
| 157.89 | Resistance | 2× | +1.73% / 267.9 pips |
| 157.31 | Resistance | 2× | +1.35% / 210.1 pips |
| 152.88 | Support | 2× | -1.50% / 233.4 pips |
| 146.61 | Support | 2× | -5.54% / 860.0 pips |
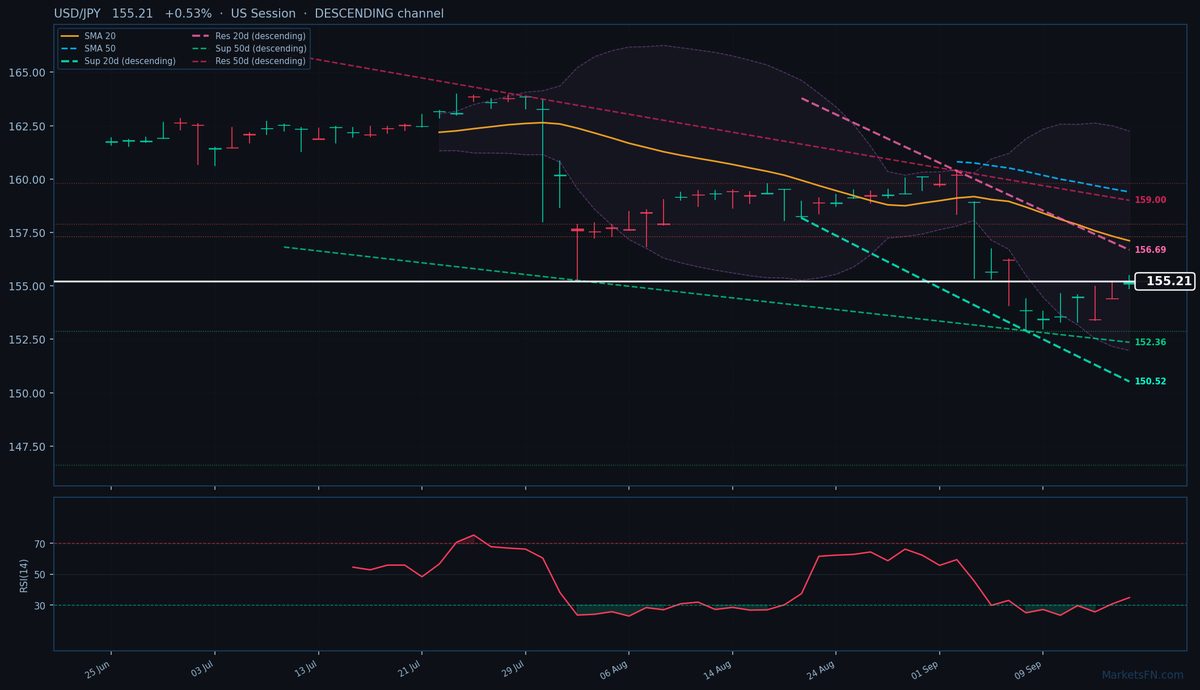
USD/JPY is trading at 155.21 (+0.53%), testing the upper bounds of its descending 20-day dynamic channel as the pair attempts to claw back from oversold conditions. The rate remains firmly below both the SMA-20 (157.11) and SMA-50 (159.40), confirming the broader downtrend, though today's push above the pivot (154.67) suggests temporary bullish momentum. The 20-day dynamic resistance sits just 147.6 pips away at 156.69, while the nearest static resistance (R1 at 157.31) looms 210.1 pips above — both likely to cap upside in the near term.
The RSI at 34.8 shows neutral momentum, neither confirming nor contradicting the current rebound attempt. With the 20-day and 50-day dynamic channels both descending (averaging -3.02% and -1.84% slopes respectively), any rally faces structural headwinds. Immediate static support (S1 at 152.88) lies 233.4 pips below, though the more critical dynamic support is the 20-day trendline at 150.52 (-468.9 pips).
Short-term, the pair's ability to hold above today's pivot (154.67) will determine whether this is a dead-cat bounce or a meaningful reversal. A failure to breach the 20-day dynamic resistance (156.69) would reinforce the downtrend, while a close above SMA-20 (157.11) could signal exhaustion of bearish momentum. Watch US session flows — today's high (155.49) is the immediate test for bulls.
Disclaimer
The content on MarketsFN.com is provided for educational and informational purposes only and does not constitute financial advice. All investments involve risk and past performance does not guarantee future results.