USD/JPY: Up 0.07% to 156.87 — Bearish — Below Key MAs
MarketsFN Team
USD/JPY: Up 0.07% to 156.87 — Bearish — Below Key MAs
Published: October 23, 2026 · MarketsFN Team · US Session
| Pair | Rate | Change | RSI(14) | SMA-20 | SMA-50 | 52W High | 52W Low | Pivot | R1 | S1 |
|---|---|---|---|---|---|---|---|---|---|---|
| USD/JPY | 156.87 | +0.07% | 36.2 | 157.87 | 157.55 | 163.84 | 152.16 | 157.23 | 157.77 | 156.21 |
📊 Support & Resistance Levels
Dynamic Trendlines
| Level | Type | Direction | Distance |
|---|---|---|---|
| 156.07 | 20d Support | → flat | -0.51% / 79.9 pips |
| 159.33 | 20d Resistance | ↗ ascending | +1.57% / 245.6 pips |
| 154.66 | 50d Support | ↗ ascending | -1.41% / 221.3 pips |
| 158.61 | 50d Resistance | ↘ descending | +1.11% / 173.8 pips |
Static Levels
| Level | Type | Touches | Distance |
|---|---|---|---|
| 159.85 | Resistance | 2× | +1.96% / 306.6 pips |
| 157.91 | Resistance | 2× | +0.72% / 112.7 pips |
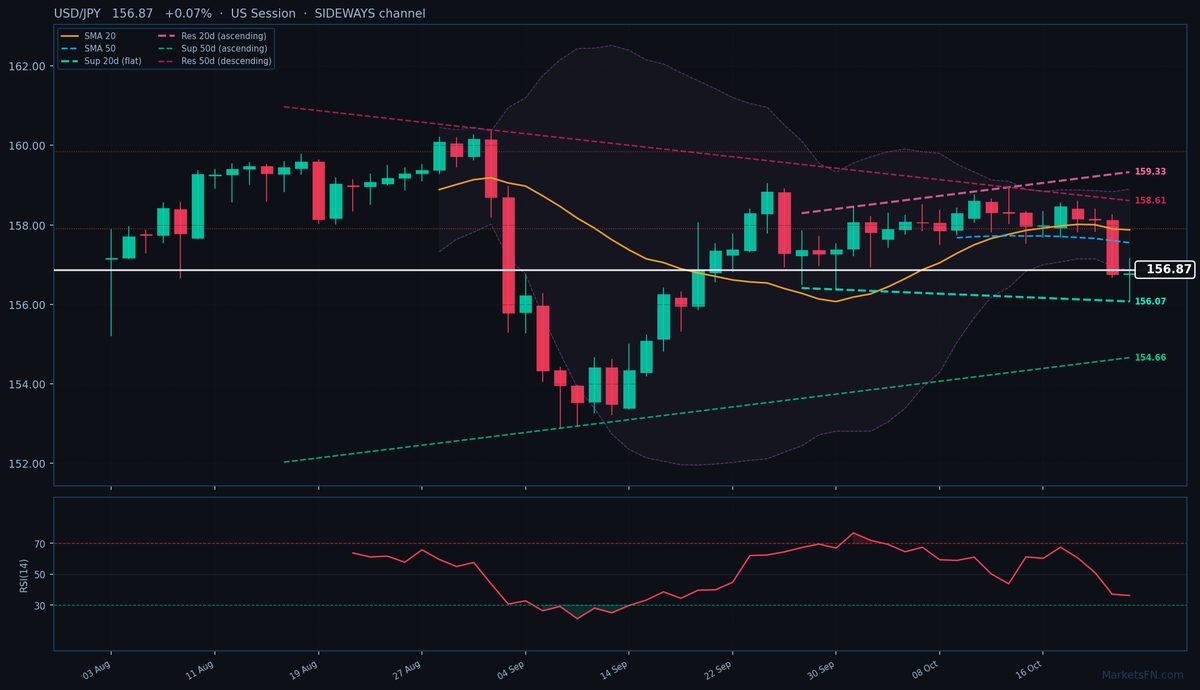
USD/JPY is trading at 156.87 (+0.07%), clinging to the lower half of its 20-day sideways channel as bearish momentum persists. The pair remains firmly below both the 20-day (157.87) and 50-day (157.55) SMAs, confirming the downtrend that began after the October 10 rejection at 159.33. Current price action shows a failed attempt to breach the 157.16 intraday high, leaving the pair vulnerable to retest the 20-day dynamic support at 156.07 (flat channel, 79.9 pips below). The 50-day dynamic resistance at 158.61 (descending, 173.8 pips above) continues to cap upside potential, while the ascending 50-day support at 154.66 (221.3 pips below) offers distant downside protection.
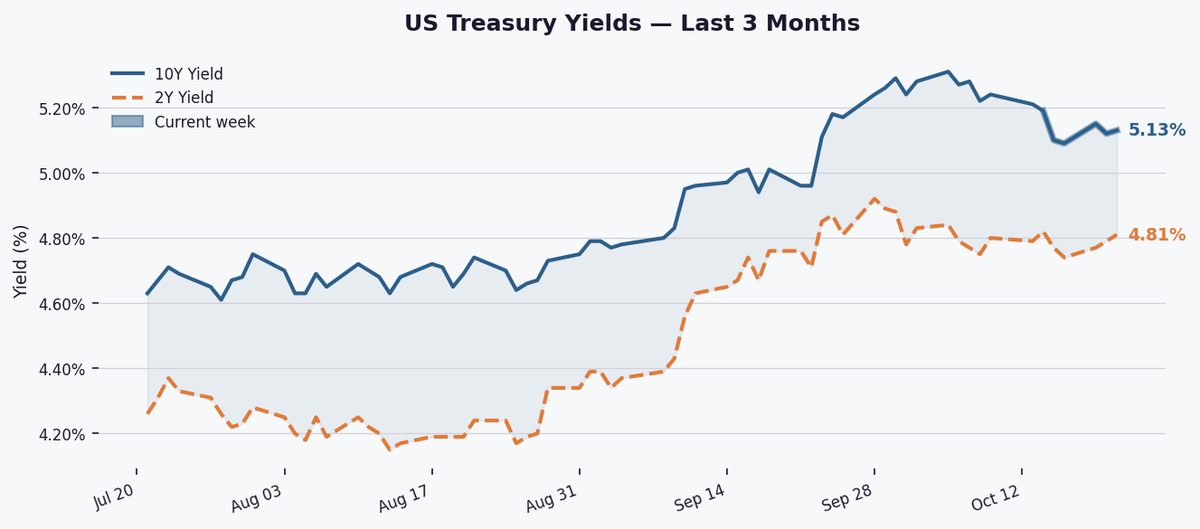
Static levels highlight immediate battlegrounds: S1 at 156.21 (66.6 pips below) aligns with today’s low, while R1 at 157.77 (90.0 pips above) coincides with the 20-day SMA. The RSI at 36.2 shows neutral momentum but leans bearish, lacking conviction for either breakout. With ATR at 0.81, today’s range is typical, but failure to hold above 156.50 could trigger a retest of the 20-day support. The short-term outlook remains bearish below the SMAs, with a break below 156.07 opening a path toward 155.00. Confirmation of bearish control would require a daily close below the 20-day dynamic support, while bulls need a decisive break above 157.77 to challenge the descending 50-day resistance. Watch US Treasury yields and BoJ rhetoric for catalysts.
Disclaimer
The content on MarketsFN.com is provided for educational and informational purposes only and does not constitute financial advice. All investments involve risk and past performance does not guarantee future results.