NZD/USD: Up 0.32% to 0.5698 — Price Holds Above SMA-20
MarketsFN Team
NZD/USD: Up 0.32% to 0.5698 — Price Holds Above SMA-20
Published: October 23, 2026 · MarketsFN Team · US Session
| Pair | Rate | Change | RSI(14) | SMA-20 | SMA-50 | 52W High | 52W Low | Pivot | R1 | S1 |
|---|---|---|---|---|---|---|---|---|---|---|
| NZD/USD | 0.5698 | +0.32% | 67.8 | 0.5632 | 0.5754 | 0.6075 | 0.5581 | 0.5685 | 0.5704 | 0.5662 |
📊 Support & Resistance Levels
Dynamic Trendlines
| Level | Type | Direction | Distance |
|---|---|---|---|
| 0.5558 | 20d Support | → flat | -2.46% / 140.1 pips |
| 0.5711 | 20d Resistance | ↗ ascending | +0.21% / 12.0 pips |
| 0.5459 | 50d Support | ↘ descending | -4.19% / 239.0 pips |
| 0.5703 | 50d Resistance | ↘ descending | +0.08% / 4.4 pips |
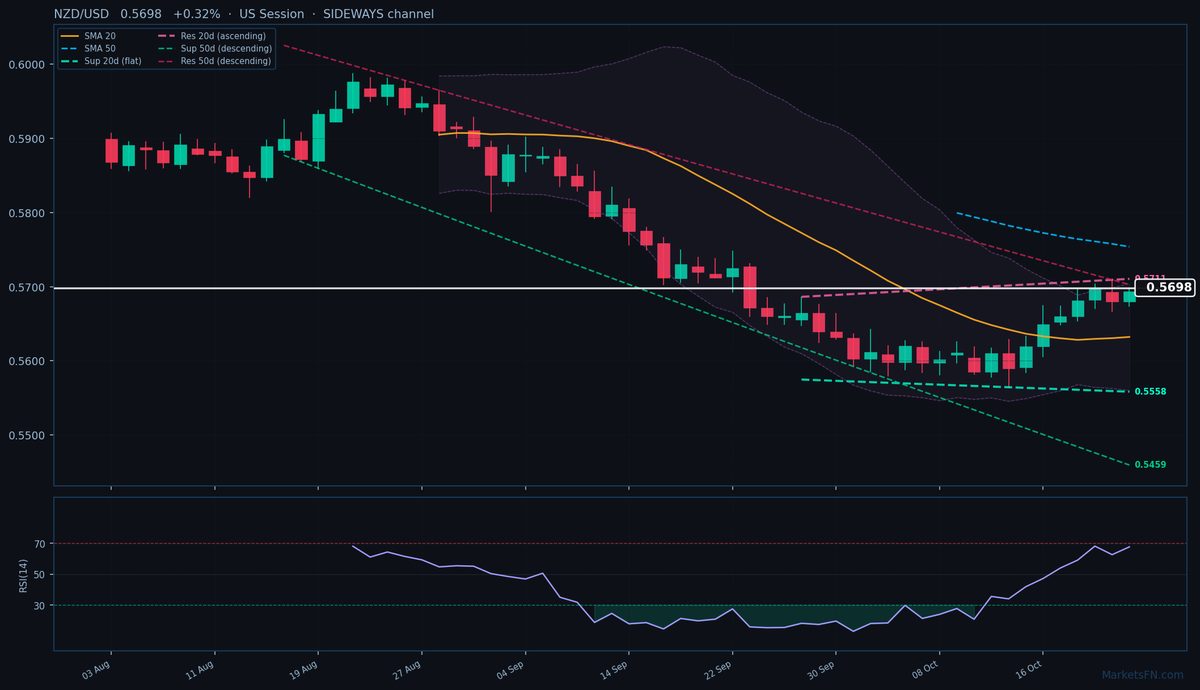
NZD/USD is trading at 0.5698 (+0.32%), testing the upper bounds of a tightening consolidation phase as it straddles key moving averages. The pair sits above its SMA-20 (0.5632) but remains capped by the SMA-50 (0.5754), reflecting a neutral bias with +66 pips to the 50-day average. Price action is compressing between dynamic trendlines — the 20-day resistance at 0.5711 (ascending, +12 pips) and 50-day resistance at 0.5703 (descending, +4 pips) form a near-term ceiling, while the 20-day flat support at 0.5558 (-140 pips) anchors the downside. The descending 50-day channel (-4.11% slope) suggests broader bearish pressure, but the pair's ability to hold above the 20-day SMA and pivot (0.5685, +13 pips) signals near-term resilience.
Static levels show immediate resistance at R1 (0.5704, +6 pips) — a break here could trigger a test of the 20-day dynamic resistance. Support clusters at S1 (0.5662, -36 pips) and the pivot, with a failure below risking a retest of the 20-day SMA. RSI at 67.8 nears overbought territory but lacks divergence, suggesting momentum could extend if 0.5704 breaks. The short-term outlook hinges on whether the pair can overcome the confluence of descending 50-day resistance and R1. A close above 0.5711 would confirm bullish momentum toward the SMA-50, while rejection here may see a retreat to 0.5662. Watch US session flows for catalyst — the 4.4-pip proximity to 50-day resistance makes this a decisive inflection point.
Disclaimer
The content on MarketsFN.com is provided for educational and informational purposes only and does not constitute financial advice. All investments involve risk and past performance does not guarantee future results.