GBP/USD: Down 0.22% to 1.3368 — Ascending Channel
MarketsFN Team
GBP/USD: Down 0.22% to 1.3368 — Ascending Channel
Published: October 23, 2026 · MarketsFN Team · US Session
| Pair | Rate | Change | RSI(14) | SMA-20 | SMA-50 | 52W High | 52W Low | Pivot | R1 | S1 |
|---|---|---|---|---|---|---|---|---|---|---|
| GBP/USD | 1.3368 | -0.22% | 64.0 | 1.3271 | 1.3402 | 1.3846 | 1.3019 | 1.3390 | 1.3426 | 1.3362 |
📊 Support & Resistance Levels
Dynamic Trendlines
| Level | Type | Direction | Distance |
|---|---|---|---|
| 1.3140 | 20d Support | → flat | -1.71% / 228.3 pips |
| 1.3430 | 20d Resistance | ↗ ascending | +0.46% / 61.2 pips |
| 1.2978 | 50d Support | ↘ descending | -2.92% / 390.0 pips |
| 1.3412 | 50d Resistance | ↘ descending | +0.33% / 44.1 pips |
Static Levels
| Level | Type | Touches | Distance |
|---|---|---|---|
| 1.3567 | Resistance | 2× | +1.45% / 193.8 pips |
| 1.3507 | Resistance | 2× | +1.00% / 133.5 pips |
| 1.3480 | Resistance | 2× | +0.80% / 106.9 pips |
| 1.3322 | Support | 2× | -0.38% / 51.1 pips |
| 1.3303 | Support | 2× | -0.52% / 70.1 pips |
| 1.3182 | Support | 2× | -1.43% / 191.5 pips |
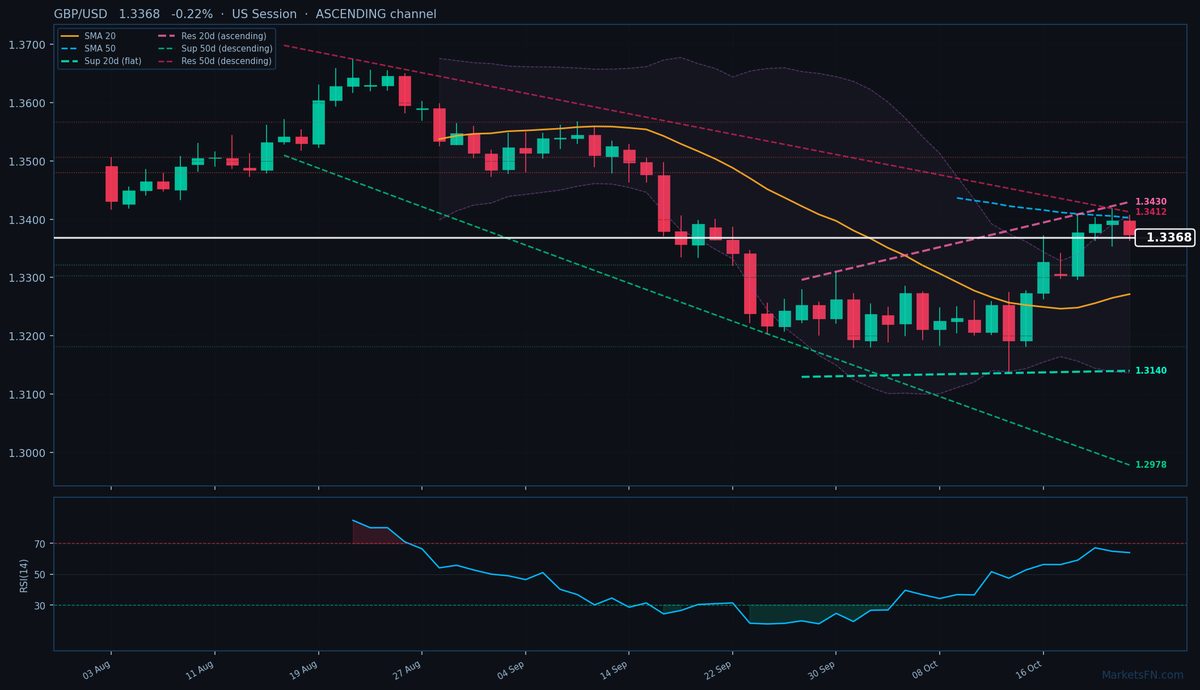
GBP/USD is trading at 1.3368 (-0.22%), testing the lower bound of its recent consolidation phase as it struggles to hold above the 50-day SMA (1.3402) while remaining supported by the 20-day SMA (1.3271). The pair is caught between conflicting channel dynamics: the 20-day trendlines form an ascending channel (support at 1.3140, 228.3 pips below; resistance at 1.3430, 61.2 pips above), while the 50-day channel remains descending (resistance at 1.3412, 44.1 pips above; support at 1.2978, 390.0 pips below). This technical tug-of-war reflects indecision, with immediate static support at 1.3322 (51.1 pips below) and resistance at 1.3480 (106.9 pips above) framing the near-term range.
The RSI at 64.0 shows neutral momentum, neither overbought nor oversold, suggesting room for movement in either direction. With the 20-day ATR at 74 pips, today’s 43-pip range (1.3364–1.3407) is notably tight, indicating potential for a breakout. The market appears to be underpricing the significance of the 50-day SMA (1.3402) and the descending 50-day resistance (1.3412) converging just 44 pips above current levels — a clear break here could trigger short-covering toward 1.3480. Conversely, failure to hold 1.3322 support risks a test of the 20-day SMA at 1.3271.
The key catalyst will be whether the pair can reclaim 1.3402 (50-day SMA) in the US session — a close above this level would confirm the ascending 20-day channel’s dominance, while rejection would reinforce the broader 50-day downtrend. Watch for a breakout beyond today’s range with volume confirmation.
Disclaimer
The content on MarketsFN.com is provided for educational and informational purposes only and does not constitute financial advice. All investments involve risk and past performance does not guarantee future results.