USD/JPY: Down 0.16% to 158.21 — Ascending Channel
MarketsFN Team
USD/JPY: Down 0.16% to 158.21 — Ascending Channel
Published: October 20, 2026 · MarketsFN Team · US Session
| Pair | Rate | Change | RSI(14) | SMA-20 | SMA-50 | 52W High | 52W Low | Pivot | R1 | S1 |
|---|---|---|---|---|---|---|---|---|---|---|
| USD/JPY | 158.21 | -0.16% | 58.0 | 158.00 | 157.68 | 163.84 | 152.16 | 158.23 | 158.77 | 157.92 |
📊 Support & Resistance Levels
Dynamic Trendlines
| Level | Type | Direction | Distance |
|---|---|---|---|
| 157.80 | 20d Support | ↗ ascending | -0.26% / 41.1 pips |
| 158.92 | 20d Resistance | → flat | +0.45% / 71.0 pips |
| 154.50 | 50d Support | ↗ ascending | -2.35% / 371.3 pips |
| 158.75 | 50d Resistance | ↘ descending | +0.34% / 54.3 pips |
Static Levels
| Level | Type | Touches | Distance |
|---|---|---|---|
| 159.85 | Resistance | 2× | +1.18% / 185.6 pips |
| 157.52 | Support | 2× | -0.29% / 46.6 pips |
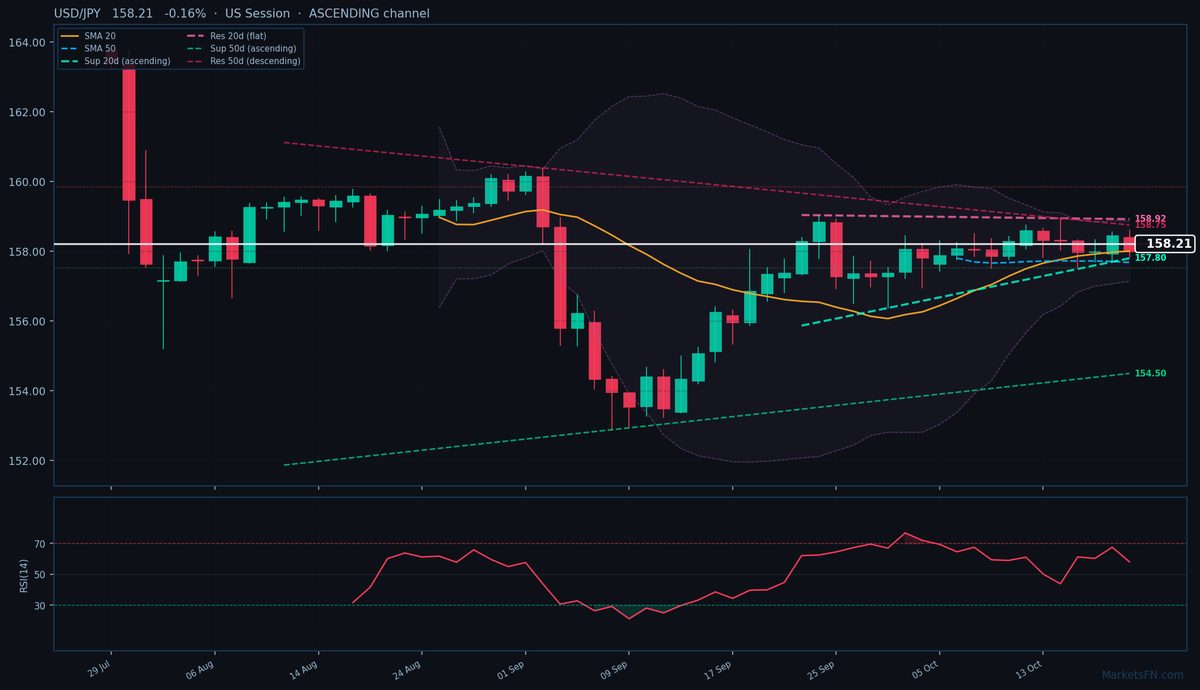
USD/JPY is trading at 158.21 (-0.16%), testing the lower bounds of its ascending 20-day channel as the pair consolidates near critical short-term moving averages. The rate remains above both the SMA-20 (158.00) and SMA-50 (157.68), confirming the broader uptrend, but today's dip below the pivot (158.23) suggests near-term exhaustion. Immediate dynamic support sits at 157.80 (41.1 pips below), an ascending trendline that has held since early October, while resistance looms at 158.92 (71.0 pips above) — a flat ceiling that capped gains twice last week. The 50-day channel paints a murkier picture, with descending resistance at 158.75 (54.3 pips away) clashing with ascending support far below at 154.50 (371.3 pips away), signaling potential compression ahead.
Static levels highlight the battleground: S1 at 157.52 (46.6 pips below) marks a double-touch floor from mid-October, while the next meaningful resistance cluster waits at 159.85 (185.6 pips above). RSI at 58.0 shows neutral momentum, neither overbought nor oversold, leaving room for directional conviction. With ATR(14) at 0.82, today's range (157.84–158.60) aligns with typical volatility.
The immediate test is whether the 20-day dynamic support (157.80) holds — a break could trigger a retest of the SMA-50 (157.68) and static S1 (157.52). Upside requires clearing 158.77 (R1 pivot) to challenge the descending 50-day resistance (158.75). Watch US session flows for momentum; a close above 158.60 (today's high) would reinforce the ascending channel.
Disclaimer
The content on MarketsFN.com is provided for educational and informational purposes only and does not constitute financial advice. All investments involve risk and past performance does not guarantee future results.