Bank credit expands $20.1B as C&I loans surge 10% YoY, outpacing sluggish real estate growth
MarketsFN Data Team
The H.8 — Assets and Liabilities of Commercial Banks in the United States — is a weekly statistical release from the Federal Reserve, published every Friday at 4:15 PM ET. It covers the combined balance sheet of all US-chartered commercial banks, covering roughly $19+ trillion in total assets. Because bank credit underpins most economic activity — business investment, home purchases, consumer spending — the H.8 is one of the most closely watched leading indicators of economic health.
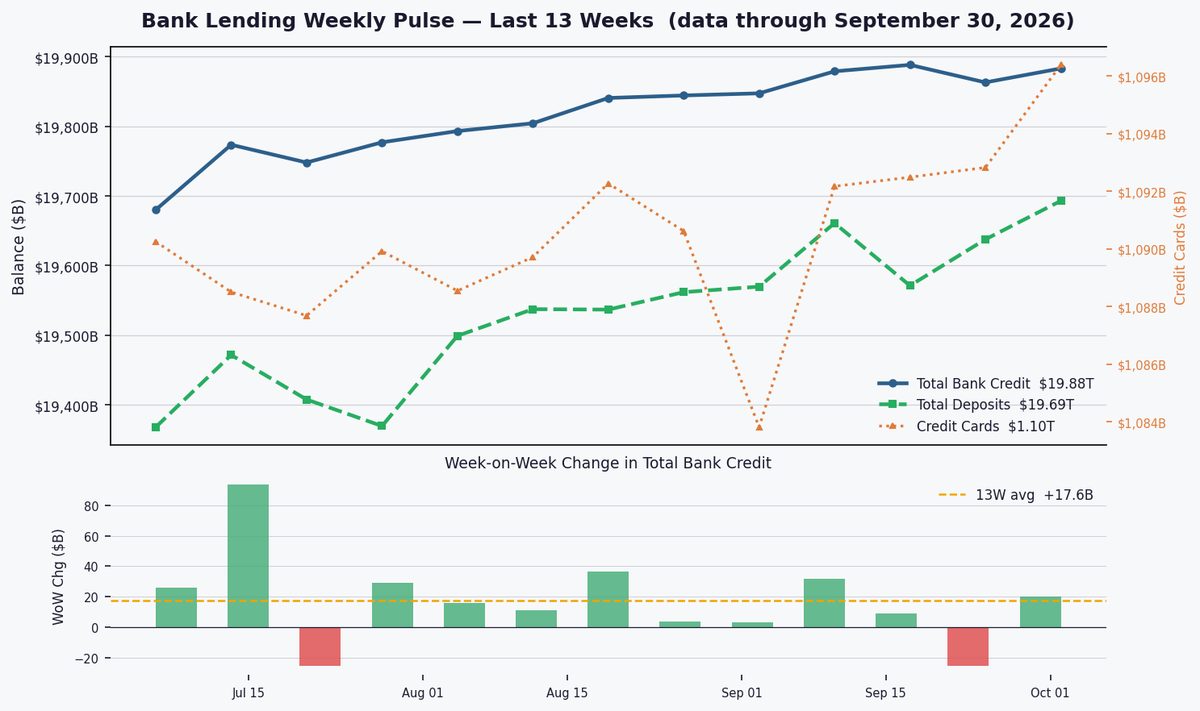
Total bank credit ($19.88T today) includes two major components: loans and leases (direct lending to businesses and households) and securities (government bonds, MBS, and other fixed-income holdings). Of the two, loans are the more economically significant — they create new purchasing power. Securities holdings fluctuate with the Fed's QE/QT cycles and banks' liquidity management decisions, not with private sector borrowing demand.
C&I loans ($2.96T, 28% of total) are commercial and industrial loans — credit to businesses for working capital, equipment, and operations. They are a leading indicator of corporate confidence. Real estate loans ($5.84T, 54%) cover mortgages and commercial property. Consumer loans ($1.93T, 18%) include credit cards, auto loans, and student debt — a direct read on household financial health.
The credit/deposit ratio compares total bank credit extended to total deposits held. A ratio above 100% means banks are lending out (or investing in securities) more than they hold in deposits — they must fund the gap via wholesale markets or equity. Currently at 101.0%, this metric signals whether the banking system is in a phase of credit expansion (ratio rising), contraction (falling), or deposit flight (deposits falling faster than credit).
Total bank credit rose to $19.88T (+$20.1B WoW) with a 101.0% credit/deposit ratio, signaling continued lending appetite despite Fed Funds at 3.75%, as businesses drive expansion while real estate lags.
Bank credit grew $20.1B this week, above the 13-week average of +$17.6B, confirming steady credit expansion. Deposits rose $55.3B, easing funding pressures, while credit card loans increased $3.6B (+4.0% YoY) — a moderate pace suggesting consumer spending resilience without acute stress signals.
C&I loans surged 10.0% YoY to $2.96T (27.6% of total), the clear growth engine, while real estate loans (+2.6% YoY) stagnate at $5.84T (54.4%). Consumer loans grew 5.0% YoY, with credit cards at +4.0% — neither overheating nor retrenching, reflecting balanced household borrowing.

The 101.0% credit/deposit ratio slightly exceeds the 4-year average (100.6%), indicating manageable funding pressure. With Fed Funds at 3.75%, deposit growth (+$55.3B WoW) supports lending, though banks remain cautious on liquidity. Current conditions favor measured expansion, not tightening.
Full Statistics Dashboard
| Metric | Latest Value | Change / Context | Frequency |
|---|---|---|---|
| Data through | September 30, 2026 | Weekly H.8 | |
| Total bank credit | $19.88T | ▲ $20.1B WoW +5.6% YoY | Weekly |
| Total deposits | $19.69T | ▲ $55.3B WoW +6.4% YoY | Weekly |
| Credit cards | $1.10T | ▲ $3.6B WoW +4.0% YoY | Weekly |
| Credit / deposit ratio | 101.0% | 4Y avg: 100.6% | Weekly |
| C&I loans | $2.96T | 27.6% of loans +10.0% YoY | Monthly |
| Real estate loans | $5.84T | 54.4% of loans +2.6% YoY | Monthly |
| Consumer loans | $1.93T | 18.0% of loans +5.0% YoY | Monthly |
| Fed Funds Rate | 3.75% | Monthly | |
| Lending signal | EXPANDING | 13W avg WoW: +$17.6B |
Weekly series through September 30, 2026 (H.8 weekly, SA). Monthly categories through September 2026 — published in same H.8 release with ~6-week lag.
Watch September payrolls and CPI for loan demand cues. Credit card growth at 4.0% YoY must be monitored for delinquency cracks. A sustained WoW credit expansion above $20B would confirm accelerating conditions, while a drop below $15B may signal contraction.