NZD/USD: Up 0.32% to 0.5678 — Descending Channel
MarketsFN Team
NZD/USD: Up 0.32% to 0.5678 — Descending Channel
Published: October 20, 2026 · MarketsFN Team · US Session
| Pair | Rate | Change | RSI(14) | SMA-20 | SMA-50 | 52W High | 52W Low | Pivot | R1 | S1 |
|---|---|---|---|---|---|---|---|---|---|---|
| NZD/USD | 0.5678 | +0.32% | 59.5 | 0.5628 | 0.5764 | 0.6075 | 0.5581 | 0.5661 | 0.5673 | 0.5647 |
📊 Support & Resistance Levels
Dynamic Trendlines
| Level | Type | Direction | Distance |
|---|---|---|---|
| 0.5556 | 20d Support | ↘ descending | -2.15% / 122.3 pips |
| 0.5688 | 20d Resistance | ↘ descending | +0.18% / 10.0 pips |
| 0.5509 | 50d Support | ↘ descending | -2.98% / 169.4 pips |
| 0.5688 | 50d Resistance | ↘ descending | +0.18% / 10.1 pips |
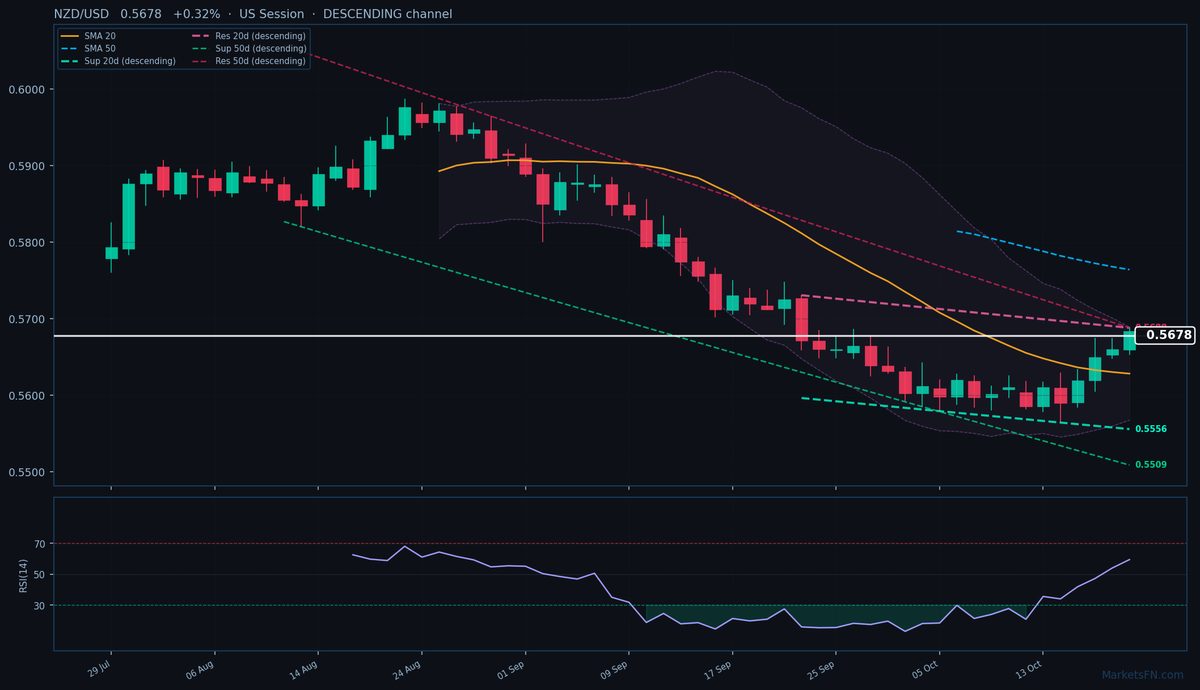
NZD/USD is trading at 0.5678 (+0.32%), testing the upper bounds of a descending 20-day dynamic channel as buyers attempt to break the downtrend. The pair is caught in a consolidation phase, trading above its 20-day SMA (0.5628) but still below the 50-day SMA (0.5764), reflecting indecision after a prolonged decline from the 52-week high of 0.6075. Immediate dynamic resistance looms at 0.5688 (+0.07%, 10.0 pips above), which aligns perfectly with today’s session high and the descending 20-day resistance trendline. A failure here would reinforce the bearish channel structure, with dynamic support at 0.5556 (-2.26%, 122.3 pips below). Static levels show a tight pivot range, with S1 at 0.5647 (-0.55%, 31 pips below) and R1 at 0.5673 (-0.09%, 5 pips below), suggesting minimal room for upside before sellers re-engage. RSI at 59.5 is neutral but nearing overbought territory, increasing the risk of rejection at resistance.
The descending channels across both 20-day and 50-day timeframes (-0.07% to -3.08% slopes) confirm the broader downtrend, though the recent push above the 20-day SMA hints at short-term bullish momentum. A decisive break above 0.5688 could target 0.5720 (next static resistance cluster), but the path of least resistance remains downward unless the pair sustains above the 50-day SMA. Watch for a reversal candle at dynamic resistance or a close above 0.5688 to confirm the next leg. The US session’s price action will be critical — a failure to hold gains today likely resumes the downtrend toward 0.5556.
Disclaimer
The content on MarketsFN.com is provided for educational and informational purposes only and does not constitute financial advice. All investments involve risk and past performance does not guarantee future results.