10Y Yield Holds Near 5.09% as Curve Steepens Slightly Amid Fed Watch
MarketsFN Data Team
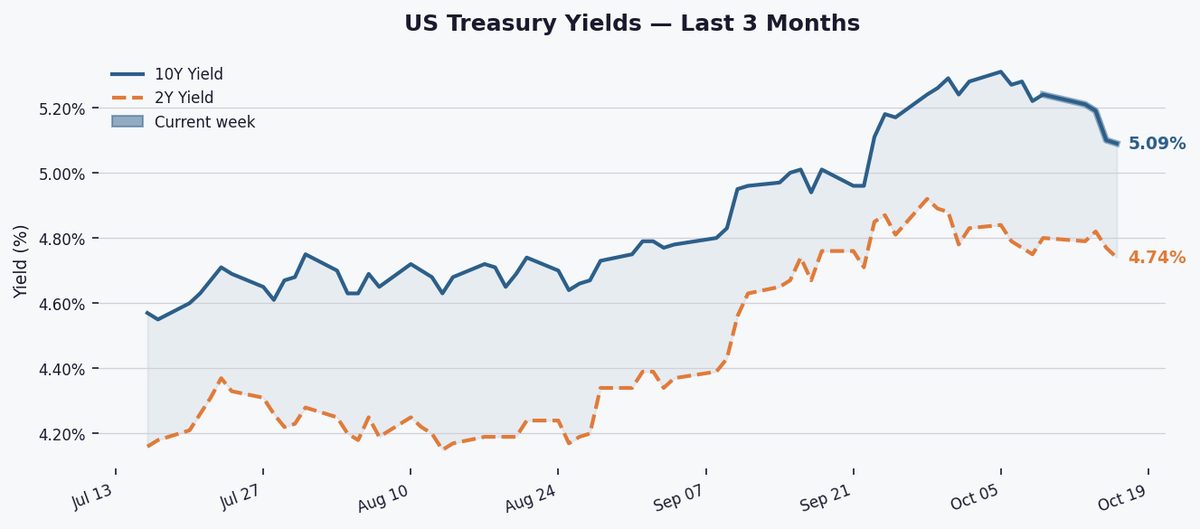
The 10Y Treasury yield edged down 1 bp to 5.09% Tuesday, extending its weekly drop by 13 bps, while the 2Y-10Y spread widened to +38 bps, maintaining a positive curve signal.
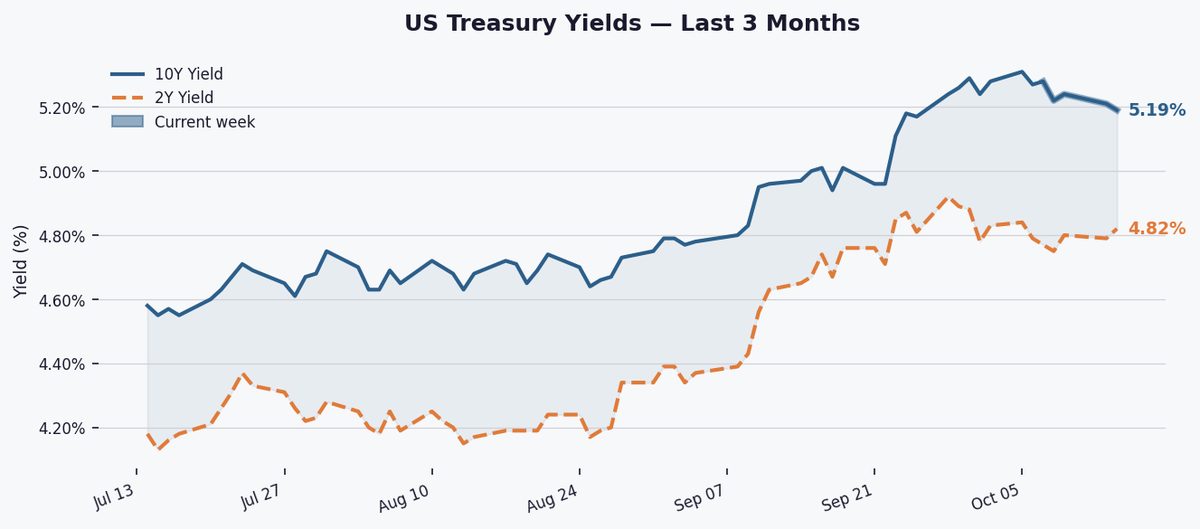
The 10Y yield at 5.09% remains 22 bps above its 3-month average (4.87%) and 67 bps higher than its 1-year average (4.42%). It sits 22 bps below its 52-week high (5.31%) but 112 bps above the yearly low (3.97%), reflecting persistent inflation and growth concerns.
The 2Y-10Y spread widened to +38 bps, up 6 bps WoW, staying positively sloped but well below its 52-week high (+74 bps). Historically, a positive but narrowing spread suggests markets anticipate slower growth but no near-term recession, contrasting with inversion signals seen in 2022-2023.

Markets await Thursday’s jobless claims and Friday’s PMI data for growth clues. Fed speakers this week could reinforce rate-cut timing expectations, while geopolitical risks may spur flight-to-quality flows, potentially pressuring yields lower.
Key Statistics at a Glance
| Edition | Mid-Week Update |
| Date | Tuesday, October 20, 2026 |
| 10Y Yield | 5.09% |
| 10Y Day-on-day | ▼ 1.0 bps |
| 10Y Week-on-week | ▼ 13.0 bps |
| 10Y YTD change | +90.0 bps |
| 10Y 3-month avg | 4.87% |
| 10Y 1-year avg | 4.42% |
| 10Y 52-week high | 5.31% |
| 10Y 52-week low | 3.97% |
| 2Y Yield | 4.74% |
| 2Y–10Y Spread | +0.380% (+38.0 bps) |
| Spread WoW | ▼ 6.0 bps |
| Spread 52-week high | +0.740% |
| Spread 52-week low | +0.200% |
| Curve signal | Positive |