US Session Crude Oil Report — 26 Oct 2026
QuoteReporter
WTI crude holds near session lows at $90.86 as the US session struggles to find bullish momentum, testing the 200-day moving average while Brent shows relative strength at $103.02 with a 0.75% intraday gain. The Brent-WTI spread widens to $12.16 as European crude tightness persists, though both benchmarks remain entrenched in weekly losses exceeding 3% as demand concerns outweigh structural supply risks. Technicals paint an oversold picture with WTI’s RSI at 22.5 — its lowest since the March 2026 banking crisis — while Brent’s 38.9 reading suggests less extreme positioning. The market tests critical EMAs with WTI trading 1.6% below its 9-day average and Brent hovering precisely at its equivalent level, creating a tension point for directional conviction.
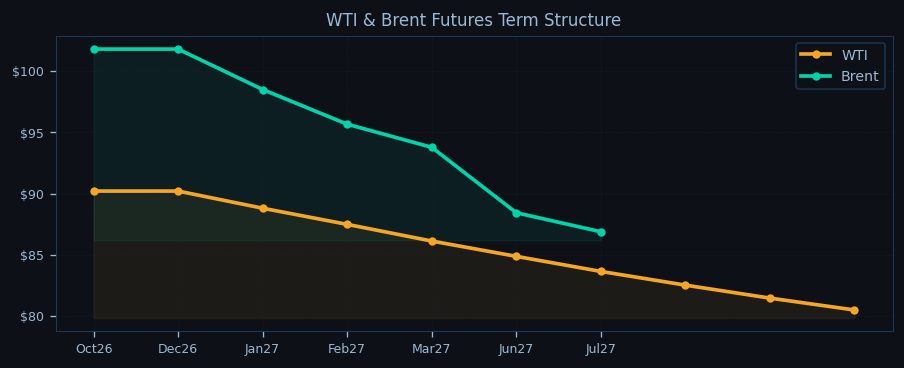
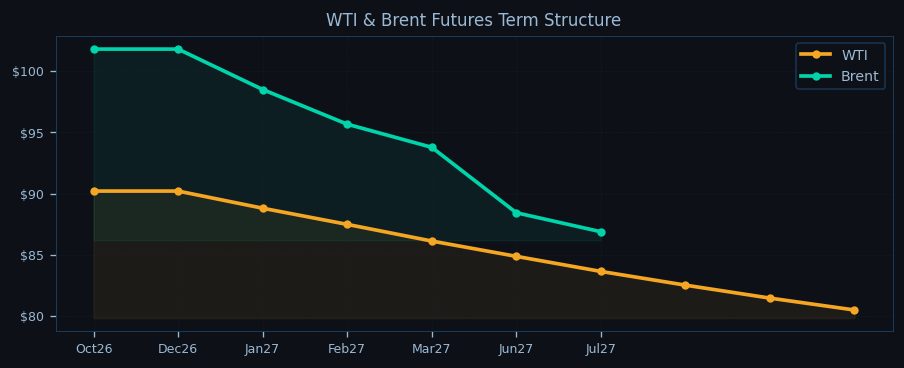
Downside momentum builds as WTI fails to hold above its pivot point at $89.46, with immediate support forming at $72.17 should the breakdown accelerate. Brent faces resistance at $103.07 — its 9-day EMA — while the $101.63 21-day EMA provides secondary support. The term structure reinforces bearish near-term sentiment with steep backwardation in both benchmarks; WTI Oct26 trades at a $10.8 discount to Jul27 while Brent’s curve shows a $14.9 contango, indicating traders price immediate scarcity but expect eventual supply relief. Geopolitical tensions provide latent support with Iranian Revolutionary Guard Corps conducting fresh tanker intercepts in the Strait of Hormuz, while Houthi attacks force VLCCs to divert around Africa — adding 7 days to voyage times and effectively removing 1.2 million barrels from prompt availability.

The EIA’s latest report shows stagnant US inventories with commercial stocks edging up 0.9 million barrels to 427.3 million, though refinery utilization holds firm at 92.5%. Cushing stocks at 24.3 million barrels remain precariously low, exacerbating WTI’s sensitivity to delivery squeeze risks. OPEC+ discipline shows cracks as Iraq and Russia exceed quotas by 120,000 bpd collectively, though Saudi Arabia maintains 100% compliance. The cartel’s production deficit narrows to 0.6 mb/d against call-on-OPEC demand, with delegates signaling no emergency meeting despite the price slide — a stance that pressures prices as algorithmic traders interpret inaction as tacit acceptance of lower levels.
Asian session positioning will hinge on whether WTI defends its 200-day MA at $90.23, with a breach opening the $89.46 pivot point and potentially triggering stop-loss cascades. Brent’s overnight range between $101.80 (front-month) and $96.17 (PP) sets the battle lines, with the $12+ Brent-WTI spread inviting arb flows that could compress differentials. Market structure suggests physical tightness is not translating into paper market strength — a divergence that may resolve through either Brent catching down to WTI’s weakness or WTI finding footing from oversold conditions. The session’s trajectory now depends on whether macro traders override the technical breakdown with fresh geopolitical risk premium, or allow momentum sellers to extend the downtrend toward the $82.16 weekly S1 level in Brent.

Disclaimer
The content on MarketsFN.com is provided for educational and informational purposes only. It does not constitute financial advice, investment recommendations, or trading guidance. All investments involve risks, and past performance does not guarantee future results. You are solely responsible for your investment decisions and should conduct independent research and consult a qualified financial advisor before acting. MarketsFN.com and its authors are not liable for any losses or damages arising from your use of this information.
Related Articles
- European Session Crude Oil Report — 26 Oct 2026 — Crude oil markets enter the European session with WTI hovering near $90.86 while Brent holds above $103, as the complex…
- US Session Crude Oil Report — 23 Oct 2026 — WTI crude is trading at $90.86 in early New York trading, holding just above the pivotal $89.46 support as Brent tests…
- European Session Crude Oil Report — 23 Oct 2026 — Crude oil markets remain under pressure in the European session as WTI hovers near $90.86, down 0.27% on the day, while…
- Asian Session Crude Oil Report — 23 Oct 2026 — WTI crude is trading at $90.86 in early Asian hours, holding near overnight lows as the contract extends its seven-day…
- US Session Crude Oil Report — 22 Oct 2026 — WTI crude is trading at $90.86 in early New York trade, testing the lower bounds of its weekly range as the contract…