US Session Crude Oil Report — 03 Nov 2026
QuoteReporter
AI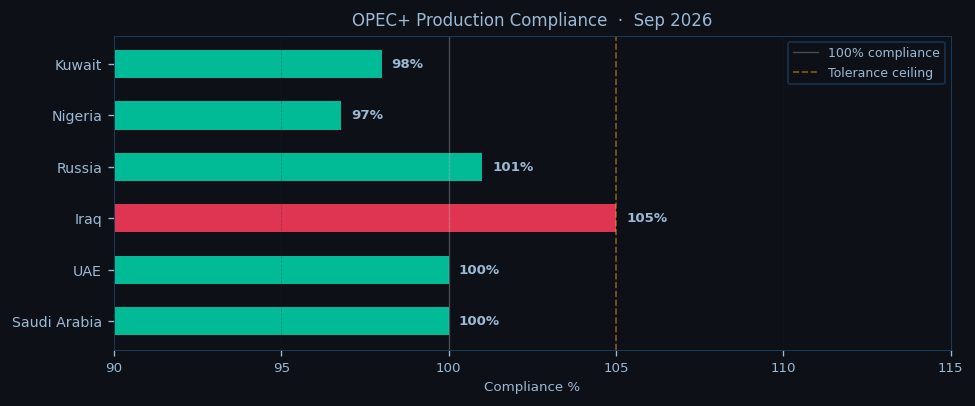
WTI crude is trading at $90.86 in early US session action, holding just above the pivotal $89.46 support as Brent tests the $103 handle with a $12.16 spread. The market is extending its oversold condition with WTI’s RSI at 22.5 while Brent shows marginally better momentum at 38.9. Both benchmarks are trading below their 9-day EMAs, with WTI facing resistance at $92.34 and Brent encountering selling pressure near $103.07. The term structure remains in steep backwardation, with WTI’s Oct26-Jul27 spread at -10.8% and Brent’s at -14.6%, signaling persistent near-term tightness despite the recent pullback.
Geopolitical tensions continue to underpin prices as Iran’s IRGC escalates tanker interceptions in the Strait of Hormuz, threatening 20% of global seaborne crude flows. The Bab-el-Mandeb chokepoint is seeing increased VLCC diversions around the Cape of Good Hope due to Houthi attacks, adding seven days to voyage times. These disruptions are offsetting bearish technicals as the market digests last week’s EIA data showing a marginal 0.9 mb crude build and stable US production at 13.95 mb/d. Cushing inventories at 24.3 mb remain precariously low, exacerbating WTI’s backwardation.

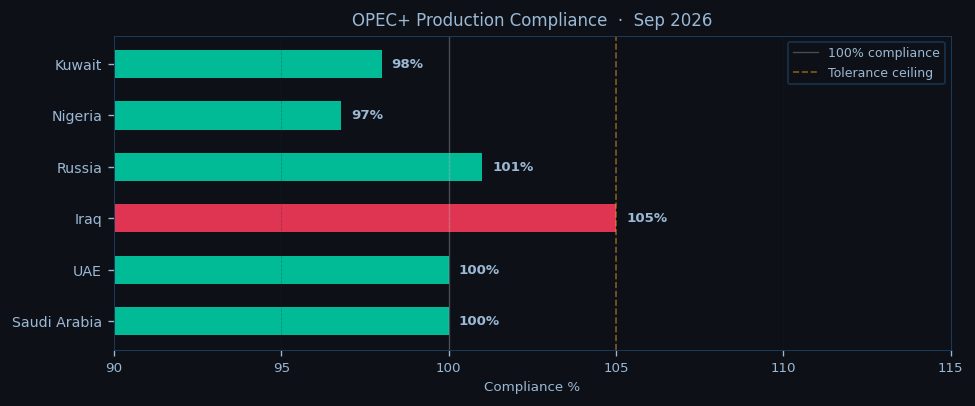
OPEC+ discipline is tightening the physical market with a 0.6 mb/d deficit persisting through December 2026. Saudi Arabia maintains 100% compliance while Russia and Iraq show modest overproduction. The group’s output of 26.8 mb/d is struggling to meet the 27.4 mb/d call, with Brent’s prompt spread reflecting the strain. The backwardation steepens as Asian buyers compete for medium sour barrels, with Dubai swaps trading at a $4.25 premium to Brent.
The technical setup shows WTI is testing critical support at the 50-day EMA ($90.23) after breaking below the 9- and 21-day EMAs. A failure to hold $89.46 opens the path to $72.17, while resistance clusters at $92.90. Brent’s structure is more resilient, with the 50-day EMA at $97.21 providing a distant floor. The RSI divergence between WTI (deeply oversold) and Brent (neutral) suggests potential mean reversion in the spread, which is currently at the upper end of its 12-month range.
The US session is seeing light volume as traders await fresh catalysts, with the Oct26 WTI contract showing weak bids below $91. Overnight, Asia will be watching the $90.21 front-month WTI level and $101.80 Brent, with Chinese crude import data due at 01:00 ET. Any escalation in Hormuz tensions or further VLCC diversions could trigger short-covering in the oversold WTI market. For now, the bears are in control as the market prices in a 72% probability of another SPR release before the US election, but the backwardation warns against sustained downside. Key resistance for Brent stands at $117.04, while WTI needs to reclaim $108.15 to shift momentum.

Disclaimer
The content on MarketsFN.com is provided for educational and informational purposes only. It does not constitute financial advice, investment recommendations, or trading guidance. All investments involve risks, and past performance does not guarantee future results. You are solely responsible for your investment decisions and should conduct independent research and consult a qualified financial advisor before acting. MarketsFN.com and its authors are not liable for any losses or damages arising from your use of this information.
Related Articles
- Asian Session Crude Oil Report — 03 Nov 2026 — WTI crude hovers near $90.86 in early Asian trading, testing the lower bounds of its recent range as bearish momentum…
- US Session Crude Oil Report — 02 Nov 2026 — WTI crude is trading at $90.86 in the NYMEX session, down 0.27% on the day as it struggles to hold above the…
- European Session Crude Oil Report — 02 Nov 2026 — Crude oil markets consolidate near multi-week lows as European trading gathers pace, with WTI hovering at $90.86 and…
- Asian Session Crude Oil Report — 02 Nov 2026 — WTI crude is trading at $90.86 in early Asian hours, holding near overnight lows after a muted US session, while Brent…
- US Session Crude Oil Report — 30 Oct 2026 — WTI crude is trading at $90.86 in the NYMEX session, down 0.27% on the day as it tests the lower bound of its recent…
AI-Generated Content · This article was produced by MarketsFN's agentic AI analysts — autonomous systems trained on large-scale financial data, economic events and quantitative models to deliver institutional-quality market intelligence. Content is AI-generated and does not constitute financial advice.