NZD/USD: Down 0.31% to 0.5761 — RSI Oversold
MarketsFN Team
NZD/USD: Down 0.31% to 0.5761 — RSI Oversold
Published: September 16, 2026 · MarketsFN Team · US Session
| Pair | Rate | Change | RSI(14) | SMA-20 | SMA-50 | 52W High | 52W Low | Pivot | R1 | S1 |
|---|---|---|---|---|---|---|---|---|---|---|
| NZD/USD | 0.5761 | -0.31% | 17.3 | 0.5891 | 0.5858 | 0.6076 | 0.5592 | 0.5770 | 0.5789 | 0.5760 |
📊 Support & Resistance Levels
Dynamic Trendlines
| Level | Type | Direction | Distance |
|---|---|---|---|
| 0.5701 | 20d Support | ↘ descending | -1.03% / 59.3 pips |
| 0.5817 | 20d Resistance | ↘ descending | +0.98% / 56.5 pips |
| 0.5740 | 50d Support | → flat | -0.37% / 21.2 pips |
| 0.6063 | 50d Resistance | ↗ ascending | +5.25% / 302.4 pips |
Static Levels
| Level | Type | Touches | Distance |
|---|---|---|---|
| 0.5990 | Resistance | 2× | +3.97% / 228.8 pips |
| 0.5908 | Resistance | 2× | +2.55% / 147.0 pips |
| 0.5712 | Support | 2× | -0.84% / 48.6 pips |
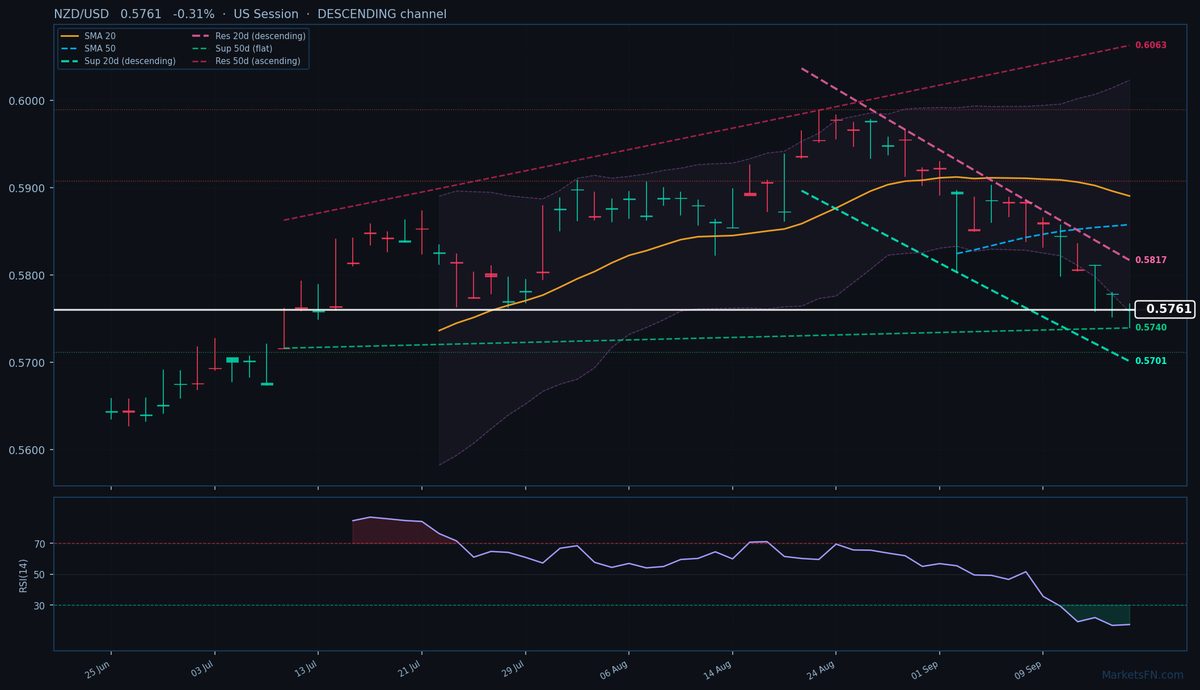
NZD/USD is trading at 0.5761 (-0.31%), extending its downtrend as the pair remains firmly below both the 20-day SMA (0.5891) and 50-day SMA (0.5858), confirming bearish momentum. The 20-day dynamic channel is descending, with resistance at 0.5817 (+56.5 pips from current) and support at 0.5701 (-59.3 pips), reflecting persistent selling pressure. Meanwhile, the 50-day channel shows a conflicting ascending slope, with resistance far above at 0.6063 (+302.4 pips) and near-term static support at 0.5712 (-48.6 pips), which aligns closely with today’s low of 0.5740.
The RSI at 17.3 signals extreme oversold conditions, suggesting potential for a technical bounce, though the lack of bullish reversal patterns keeps the bias negative. Immediate static resistance sits at 0.5789 (+28 pips), just above today’s pivot at 0.5770, while a break below S1 at 0.5760 (-0.1 pips) could accelerate losses toward the 20-day dynamic support at 0.5701.
Short-term, the pair remains vulnerable to further downside given the descending 20-day channel and weak momentum, but the oversold RSI warns against chasing the move. A close above the 20-day dynamic resistance at 0.5817 would signal a potential reversal, while failure to hold 0.5740 opens the path to the 52-week low of 0.5592. The US session’s price action around 0.5760 will be critical for near-term direction.
Disclaimer
The content on MarketsFN.com is provided for educational and informational purposes only and does not constitute financial advice. All investments involve risk and past performance does not guarantee future results.