EUR/PLN: Down 0.11% to 4.3404 — Testing 52-Week High
MarketsFN Team
EUR/PLN: Down 0.11% to 4.3404 — Testing 52-Week High
Published: September 15, 2026 · MarketsFN Team · US Session · Emerging FX
| Pair | Rate | Change | RSI(14) | SMA-20 | SMA-50 | 52W High | 52W Low | Pivot | R1 | S1 |
|---|---|---|---|---|---|---|---|---|---|---|
| EUR/PLN | 4.3404 | -0.11% | 69.0 | 4.3185 | 4.3154 | 4.3453 | 4.1967 | 4.3216 | 4.3262 | 4.3171 |
S/R Support & Resistance Levels
Dynamic Trendlines
| Level | Type | Direction | Distance |
|---|---|---|---|
| 4.3095 | 20d Support | up (ascending) | -0.71% / 309.5 pips |
| 4.3466 | 20d Resistance | flat (flat) | +0.14% / 61.2 pips |
| 4.2977 | 50d Support | flat (flat) | -0.98% / 427.2 pips |
| 4.3466 | 50d Resistance | flat (flat) | +0.14% / 61.2 pips |
Static Levels
| Level | Type | Touches | Distance |
|---|---|---|---|
| 4.2428 | Support | 2x | -2.36% / 1025.0 pips |
| 4.2408 | Support | 2x | -2.40% / 1045.0 pips |
| 4.2345 | Support | 2x | -2.55% / 1107.4 pips |
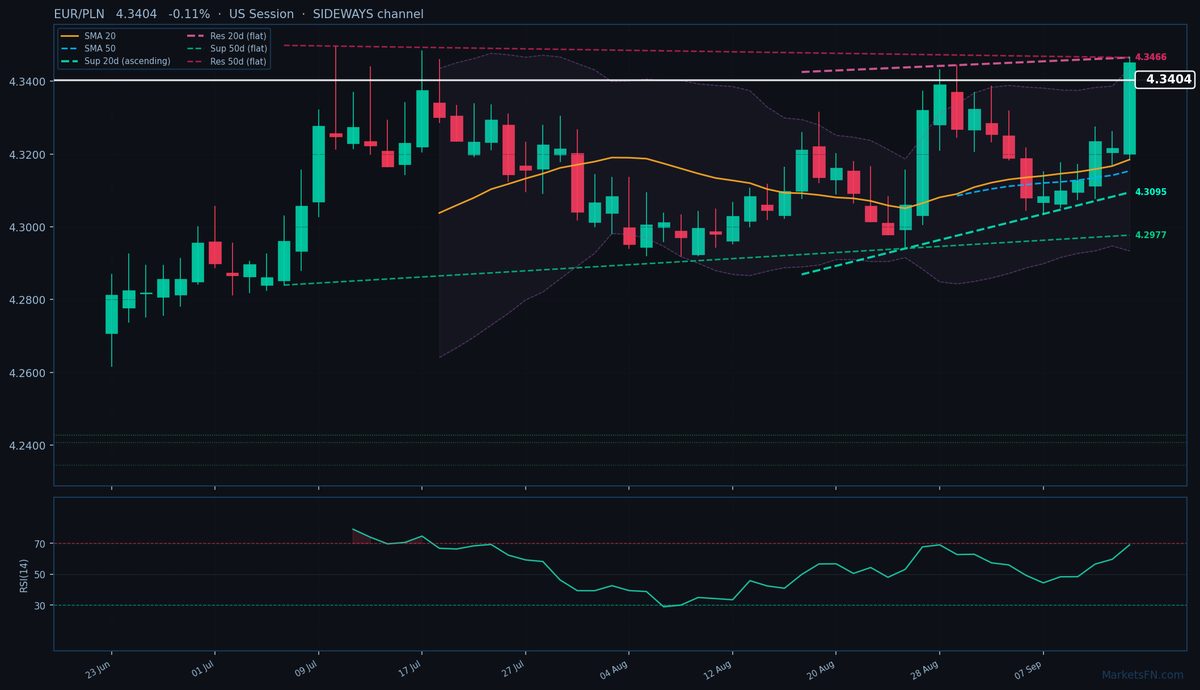
EUR/PLN is trading at 4.3404 (-0.11%), hovering just below the 52-week high of 4.3453 as the pair consolidates within a sideways 20-day dynamic channel. The rate remains firmly above both the 20-day (4.3185) and 50-day (4.3154) SMAs, confirming the short-term uptrend, though the flat 50-day resistance at 4.3466 (+61.2 pips) is capping gains. The ascending 20-day dynamic support at 4.3095 (-309.5 pips) provides a floor, while the immediate static pivot cluster shows S1 at 4.3171 (-233.3 pips) and R1 at 4.3262 (-142.2 pips) — both levels untested in today’s session.
RSI(14) at 69.0 flirts with overbought territory but hasn’t triggered divergence warnings yet, suggesting room for further upside if the pair breaches the 52-week high. The tight 20-day ATR of 0.0180 reflects subdued volatility, typical of consolidation phases. With the 20-day and 50-day dynamic resistance converging at 4.3466, a breakout there could accelerate gains toward psychological resistance at 4.3500. Conversely, failure to hold above the 20-day SMA (4.3185) would expose the dynamic support at 4.3095.
The short-term bias leans bullish given the SMA alignment and ascending support, but traders should watch for rejection at 4.3466 — a close above this level would confirm continuation, while a reversal below 4.3185 could signal exhaustion. The ECB’s policy meeting next week may break the stalemate, with any dovish tilt likely to pressure the pair toward static support.
Disclaimer
The content on MarketsFN.com is provided for educational and informational purposes only and does not constitute financial advice. All investments involve risk and past performance does not guarantee future results.