USD/ZAR: Up 0.99% to 16.1847 — Descending Channel
MarketsFN Team
USD/ZAR: Up 0.99% to 16.1847 — Descending Channel
Published: September 10, 2026 · MarketsFN Team · US Session · Emerging FX
| Pair | Rate | Change | RSI(14) | SMA-20 | SMA-50 | 52W High | 52W Low | Pivot | R1 | S1 |
|---|---|---|---|---|---|---|---|---|---|---|
| USD/ZAR | 16.1847 | +0.99% | 52.5 | 16.0539 | 16.2620 | 17.5061 | 15.7197 | 16.0223 | 16.0702 | 15.9787 |
S/R Support & Resistance Levels
Dynamic Trendlines
| Level | Type | Direction | Distance |
|---|---|---|---|
| 15.8657 | 20d Support | flat (flat) | -1.97% / 3189.9 pips |
| 16.1416 | 20d Resistance | down (descending) | -0.27% / 431.4 pips |
| 15.8135 | 50d Support | down (descending) | -2.29% / 3711.8 pips |
| 16.0586 | 50d Resistance | down (descending) | -0.78% / 1261.0 pips |
Static Levels
| Level | Type | Touches | Distance |
|---|---|---|---|
| 16.9140 | Resistance | 2x | +5.41% / 8688.0 pips |
| 16.5797 | Resistance | 2x | +3.33% / 5345.0 pips |
| 16.4811 | Resistance | 3x | +2.72% / 4359.2 pips |
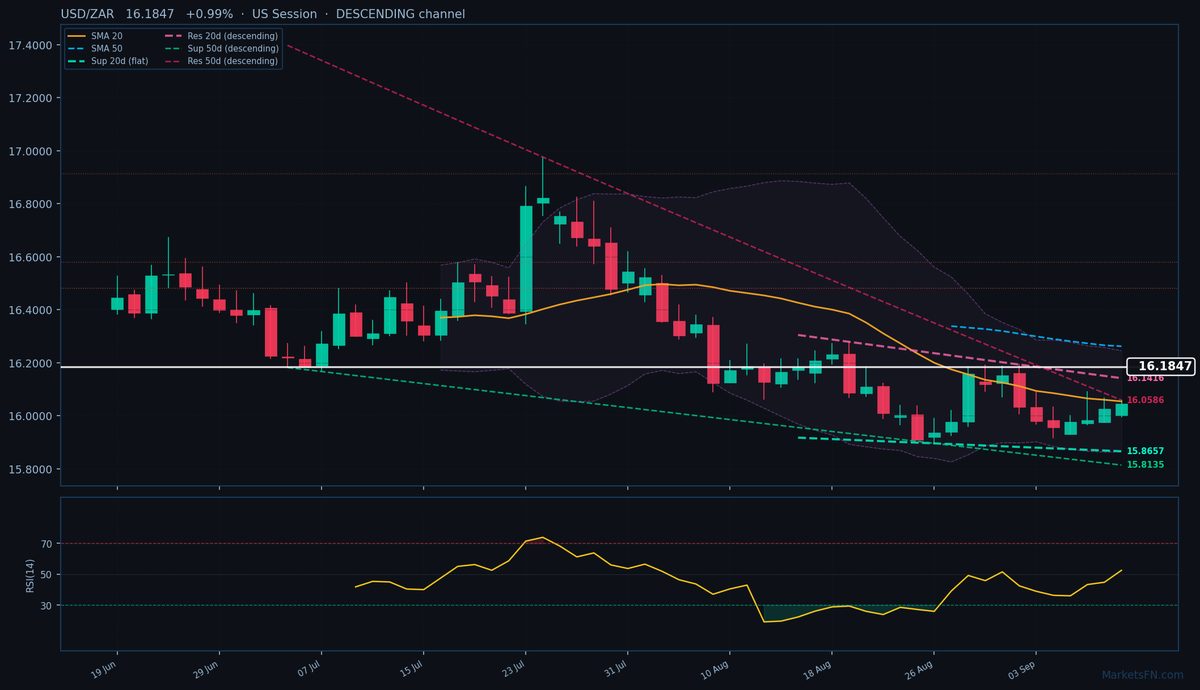
USD/ZAR is trading at 16.1847 (+0.99%), breaking above its 20-day SMA (16.0539) but still capped by the 50-day SMA (16.2620), signaling a consolidation phase between these moving averages. The pair is testing the upper bounds of its descending 20-day dynamic channel, with resistance at 16.1416 just 431.4 pips above. A decisive break here could open a path toward the 50-day dynamic resistance at 16.0586, only 1261.0 pips away. However, the broader 50-day channel remains bearish, with support far below at 15.8135 (-1.44%, 3711.8 pips away), reinforcing the downtrend bias.
Static levels show immediate support at S1 (15.9787, -1.27%, 2060.0 pips below), while the nearest meaningful resistance cluster is R1 at 16.4811 (4359.2 pips above), last tested three times. RSI at 52.5 is neutral but leaning toward bullish momentum after today’s rally. The pair’s ability to hold above the 20-day SMA suggests short-term upside potential, but the descending channels and overhead SMAs will likely limit gains.
Watch for a close above 16.1416 (20-day dynamic resistance) to confirm bullish continuation, while failure to sustain above 16.0539 (20-day SMA) could trigger a retest of S1. The European session’s price action will be critical in setting the tone for the week.
Disclaimer
The content on MarketsFN.com is provided for educational and informational purposes only and does not constitute financial advice. All investments involve risk and past performance does not guarantee future results.