USD/ZAR: Up 0.14% to 16.0056 — Descending Channel
MarketsFN Team
USD/ZAR: Up 0.14% to 16.0056 — Descending Channel
Published: September 09, 2026 · MarketsFN Team · US Session · Emerging FX
| Pair | Rate | Change | RSI(14) | SMA-20 | SMA-50 | 52W High | 52W Low | Pivot | R1 | S1 |
|---|---|---|---|---|---|---|---|---|---|---|
| USD/ZAR | 16.0056 | +0.14% | 41.7 | 16.0578 | 16.2647 | 17.5061 | 15.7197 | 16.0124 | 16.0599 | 15.9356 |
S/R Support & Resistance Levels
Dynamic Trendlines
| Level | Type | Direction | Distance |
|---|---|---|---|
| 15.8221 | 20d Support | down (descending) | -1.15% / 1835.6 pips |
| 16.1504 | 20d Resistance | down (descending) | +0.90% / 1447.8 pips |
| 15.8210 | 50d Support | down (descending) | -1.15% / 1846.0 pips |
| 16.0836 | 50d Resistance | down (descending) | +0.49% / 780.2 pips |
Static Levels
| Level | Type | Touches | Distance |
|---|---|---|---|
| 16.9140 | Resistance | 2x | +5.82% / 9299.2 pips |
| 16.5797 | Resistance | 2x | +3.73% / 5956.3 pips |
| 16.4811 | Resistance | 3x | +3.11% / 4970.4 pips |
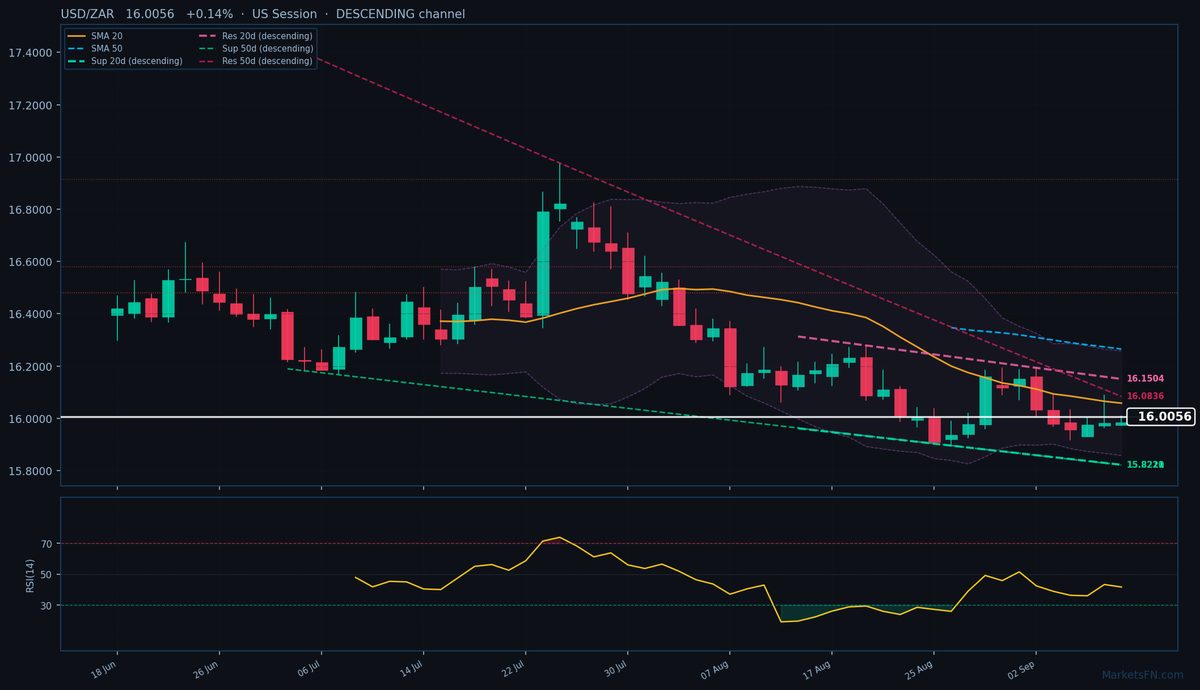
USD/ZAR is trading at 16.0056 (+0.14%), testing the lower bounds of a well-defined descending channel as bearish momentum persists. The pair remains below both the SMA-20 (16.0578, -522.2 pips) and SMA-50 (16.2647, -2591.1 pips), confirming the broader downtrend. Price action is currently probing the 20-day dynamic resistance trendline at 16.1504 (+1.04%, 1447.8 pips above), while the nearest dynamic support sits at 15.8221 (-1.01%, 1835.6 pips below) — both trendlines slope downward, reinforcing the bearish structure.
Static levels highlight immediate resistance at R1 (16.0599, +543.3 pips) and support at S1 (15.9356, -700.0 pips), with the pivot at 16.0124 just overhead. The RSI at 41.7 shows neutral momentum, neither oversold nor overbought, suggesting room for further downside before a potential reversal. The ATR(14) of 0.1149 indicates subdued volatility, typical of consolidation within the descending channel.
Short-term, the pair faces downward pressure unless it breaches the 20-day SMA or R1 static resistance. A break below S1 (15.9356) could accelerate losses toward the dynamic support at 15.8221. Watch for a close above the pivot (16.0124) to signal temporary relief, but the descending channel’s upper boundary at 16.1504 remains the critical hurdle for any trend reversal. The European session’s price action near the day’s high (16.0074) suggests tentative bullish interest, but the broader technical setup favors selling into rallies.
Disclaimer
The content on MarketsFN.com is provided for educational and informational purposes only and does not constitute financial advice. All investments involve risk and past performance does not guarantee future results.