USD/THB: Up 0.48% to 33.0270 — Price Holds Above SMA-20
MarketsFN Team
USD/THB: Up 0.48% to 33.0270 — Price Holds Above SMA-20
Published: September 10, 2026 · MarketsFN Team · US Session · Emerging FX
| Pair | Rate | Change | RSI(14) | SMA-20 | SMA-50 | 52W High | 52W Low | Pivot | R1 | S1 |
|---|---|---|---|---|---|---|---|---|---|---|
| USD/THB | 33.0270 | +0.48% | 60.1 | 32.9015 | 33.1656 | 33.7470 | 30.5160 | 32.7500 | 33.0540 | 32.5660 |
S/R Support & Resistance Levels
Dynamic Trendlines
| Level | Type | Direction | Distance |
|---|---|---|---|
| 32.1859 | 20d Support | flat (flat) | -2.55% / 8411.3 pips |
| 33.4353 | 20d Resistance | up (ascending) | +1.24% / 4082.7 pips |
| 31.6900 | 50d Support | down (descending) | -4.05% / 13370.5 pips |
| 33.2684 | 50d Resistance | down (descending) | +0.73% / 2414.2 pips |
Static Levels
| Level | Type | Touches | Distance |
|---|---|---|---|
| 32.2535 | Support | 2x | -1.94% / 6385.0 pips |
| 32.1695 | Support | 2x | -2.20% / 7225.0 pips |
| 31.5685 | Support | 2x | -4.02% / 13235.0 pips |
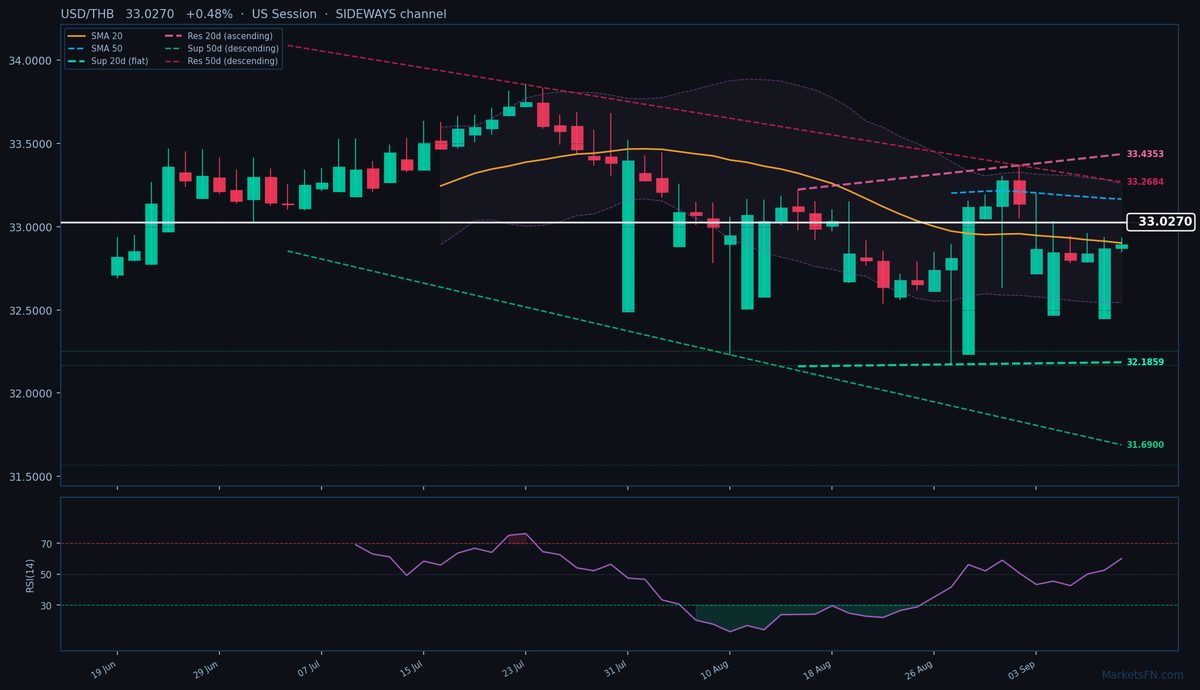
USD/THB is trading at 33.0270 (+0.48%), testing the upper bounds of a short-term consolidation phase as it holds above the SMA-20 (32.9015) but remains capped by the SMA-50 (33.1656). The pair is caught between these moving averages, reflecting indecision after the recent push above the 32.8700 previous close. The 20-day dynamic channel is sideways, with immediate resistance at 33.4353 (ascending, +1.65%, 4083 pips away) and support at 32.1859 (flat, -2.15%, 8411 pips away). Meanwhile, the 50-day channel remains descending, highlighting broader bearish pressure with resistance at 33.2684 (+1.14%, 2414 pips away) and support at 31.6900 (-3.65%, 13371 pips away).
Static levels show S1 at 32.2535 (6385 pips below) and R1 at 33.0540 (just 270 pips above), making the latter a near-term target if bullish momentum holds. RSI at 60.1 suggests neutral momentum, neither overbought nor oversold, leaving room for further directional moves. The pair’s ability to sustain above 33.0000 will be key—a break above R1 could accelerate toward the SMA-50, while failure here may see a retest of the SMA-20. Watch for a close above 33.0540 to confirm short-term bullish continuation, or a rejection at this level to signal another leg lower within the broader descending 50-day channel. The European session’s price action will set the tone for whether this is a genuine breakout or another false move.
Disclaimer
The content on MarketsFN.com is provided for educational and informational purposes only and does not constitute financial advice. All investments involve risk and past performance does not guarantee future results.