USD/THB: Up 0.27% to 33.7300 — Testing 52-Week High
MarketsFN Team
USD/THB: Up 0.27% to 33.7300 — Testing 52-Week High
Published: October 23, 2026 · MarketsFN Team · US Session · Emerging FX
| Pair | Rate | Change | RSI(14) | SMA-20 | SMA-50 | 52W High | 52W Low | Pivot | R1 | S1 |
|---|---|---|---|---|---|---|---|---|---|---|
| USD/THB | 33.7300 | +0.27% | 58.8 | 33.5196 | 33.2132 | 33.7470 | 30.5160 | 33.5357 | 33.6593 | 33.4073 |
S/R Support & Resistance Levels
Dynamic Trendlines
| Level | Type | Direction | Distance |
|---|---|---|---|
| 33.1990 | 20d Support | up (ascending) | -1.57% / 5310.4 pips |
| 33.7517 | 20d Resistance | flat (flat) | +0.06% / 216.7 pips |
| 33.1141 | 50d Support | up (ascending) | -1.83% / 6159.3 pips |
| 33.9137 | 50d Resistance | up (ascending) | +0.54% / 1836.8 pips |
Static Levels
| Level | Type | Touches | Distance |
|---|---|---|---|
| 32.4945 | Support | 2x | -3.64% / 12285.0 pips |
| 32.4505 | Support | 2x | -3.77% / 12725.0 pips |
| 32.2535 | Support | 2x | -4.36% / 14695.0 pips |
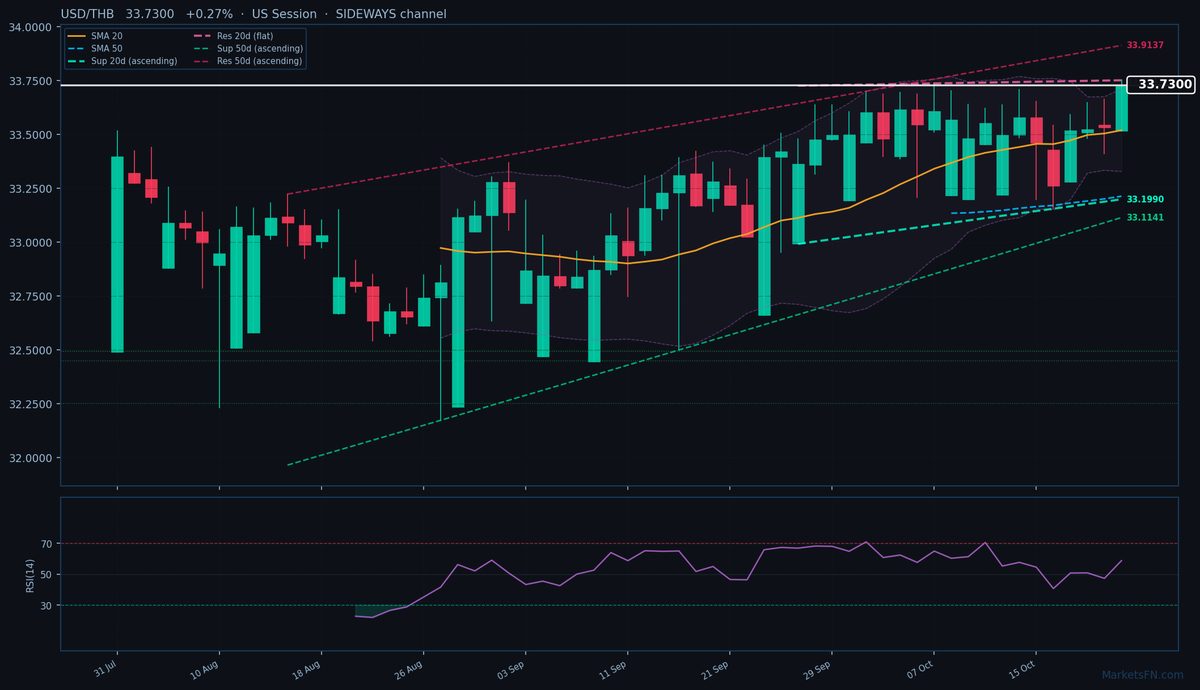
USD/THB is trading at 33.7300 (+0.27%), testing the upper bounds of its recent range as the pair extends its uptrend above both the 20-day (33.5196) and 50-day (33.2132) SMAs. The price action confirms bullish momentum, with today’s high of 33.7520 just 22 pips shy of the 52-week peak at 33.7470—a critical resistance level that, if breached, could trigger a breakout. The 20-day dynamic resistance trendline sits flat at 33.7517, a mere 216.7 pips above current levels, while the ascending 50-day dynamic resistance trends higher at 33.9137 (+0.57%, 1836.8 pips away). Dynamic support is firmer: the 20-day ascending trendline holds at 33.1990 (-1.55%, 5310.4 pips below), and the 50-day support slopes upward at 33.1141 (-1.81%, 6159.3 pips away), reinforcing the broader ascending channel.
Static levels show immediate support at S1 (33.4073, -3227 pips) and resistance at R1 (33.6593, -707 pips), though the pair has already tested near R1 today. RSI at 58.8 suggests neutral momentum, leaving room for further upside before overbought conditions emerge. Short-term, the focus is on whether USD/THB can sustain a close above 33.7470—a decisive break here would open the path toward the 50-day dynamic resistance at 33.9137. Failure to hold gains may see a retest of the 20-day SMA (33.5196) or static S1. The European session’s price action will set the tone for whether this is a genuine breakout or another rejection at multi-year highs.
Disclaimer
The content on MarketsFN.com is provided for educational and informational purposes only and does not constitute financial advice. All investments involve risk and past performance does not guarantee future results.