USD/HUF: Up 0.03% to 327.22 — Bullish — Above Key MAs
MarketsFN Team
USD/HUF: Up 0.03% to 327.22 — Bullish — Above Key MAs
Published: October 23, 2026 · MarketsFN Team · US Session · Emerging FX
| Pair | Rate | Change | RSI(14) | SMA-20 | SMA-50 | 52W High | 52W Low | Pivot | R1 | S1 |
|---|---|---|---|---|---|---|---|---|---|---|
| USD/HUF | 327.22 | +0.03% | 50.0 | 324.67 | 318.33 | 343.74 | 300.33 | 324.73 | 326.30 | 323.25 |
S/R Support & Resistance Levels
Dynamic Trendlines
| Level | Type | Direction | Distance |
|---|---|---|---|
| 322.23 | 20d Support | up (ascending) | -1.52% / 498.7 pips |
| 327.70 | 20d Resistance | down (descending) | +0.15% / 47.6 pips |
| 321.88 | 50d Support | up (ascending) | -1.63% / 534.5 pips |
| 335.69 | 50d Resistance | up (ascending) | +2.59% / 846.4 pips |
Static Levels
| Level | Type | Touches | Distance |
|---|---|---|---|
| 344.84 | Resistance | 2x | +5.41% / 1771.4 pips |
| 332.94 | Resistance | 2x | +1.78% / 581.8 pips |
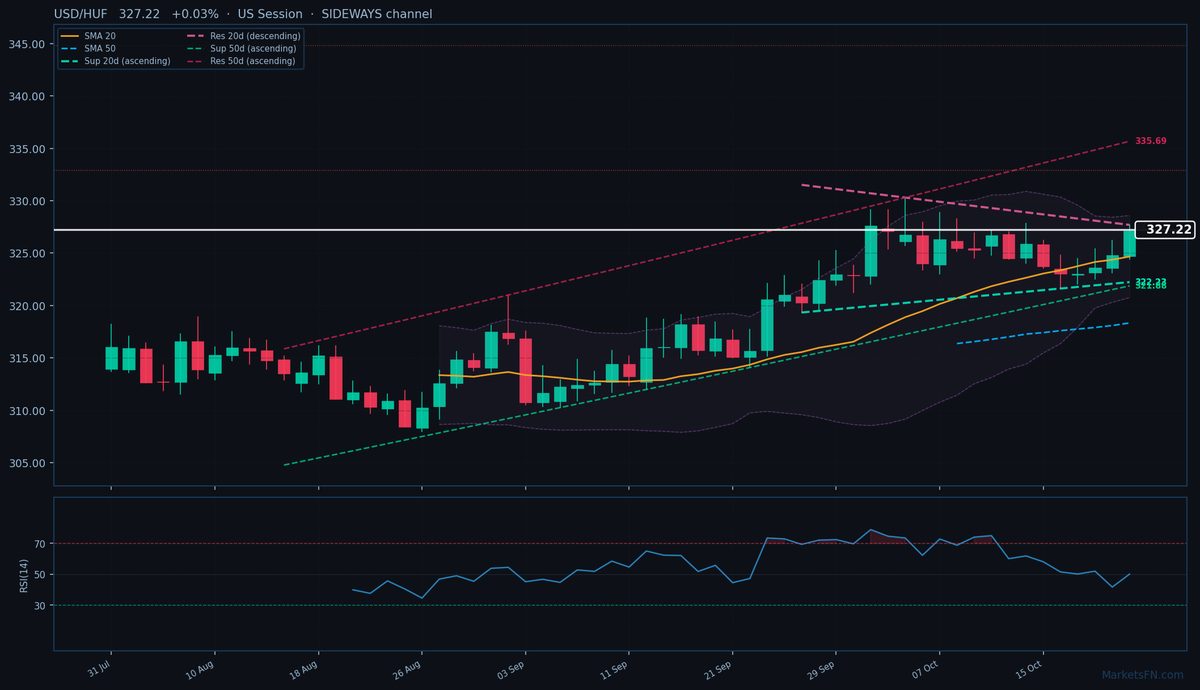
USD/HUF is trading at 327.22 (+0.03%), testing the upper bound of its 20-day descending resistance trendline at 327.70 (just 47.6 pips away) while maintaining a firm uptrend above both the SMA-20 (324.67) and SMA-50 (318.33). The pair remains in an ascending 50-day channel (support at 321.88, 534.5 pips below) with resistance sloping upward at 335.69 (846.4 pips above), suggesting structural bullish momentum despite today's muted move.
Static levels show immediate support at S1 (323.25, 397 pips below) and resistance at R1 (326.30, 92 pips above), though the more consequential pivot lies at 324.73 — a break below could trigger profit-taking toward the 20-day dynamic support at 322.23 (498.7 pips lower). RSI at 50.0 signals neutral momentum, but the pair's ability to hold above all key moving averages favors buyers.
Short-term, watch for a breakout above the 20-day descending resistance (327.70) — a close above could accelerate toward the 50-day ascending resistance (335.69). Conversely, failure to breach 327.70 may see a retest of the SMA-20 (324.67), where dip-buying interest should emerge. The 50-day channel's upward slope suggests any pullback remains a buying opportunity unless S1 (323.25) breaks decisively. Confirmation would come with a daily close above 327.70 or below 324.73.
Disclaimer
The content on MarketsFN.com is provided for educational and informational purposes only and does not constitute financial advice. All investments involve risk and past performance does not guarantee future results.