USD/THB: Up 0.03% to 32.8800 — Descending Channel
MarketsFN Team
USD/THB: Up 0.03% to 32.8800 — Descending Channel
Published: September 08, 2026 · MarketsFN Team · US Session · Emerging FX
| Pair | Rate | Change | RSI(14) | SMA-20 | SMA-50 | 52W High | 52W Low | Pivot | R1 | S1 |
|---|---|---|---|---|---|---|---|---|---|---|
| USD/THB | 32.8800 | +0.03% | 44.8 | 32.9359 | 33.1868 | 33.7470 | 30.5160 | 32.7813 | 33.0947 | 32.5317 |
S/R Support & Resistance Levels
Dynamic Trendlines
| Level | Type | Direction | Distance |
|---|---|---|---|
| 31.9796 | 20d Support | down (descending) | -2.74% / 9004.2 pips |
| 33.4016 | 20d Resistance | up (ascending) | +1.59% / 5216.2 pips |
| 31.6761 | 50d Support | down (descending) | -3.66% / 12039.2 pips |
| 33.3180 | 50d Resistance | down (descending) | +1.33% / 4380.4 pips |
Static Levels
| Level | Type | Touches | Distance |
|---|---|---|---|
| 32.2535 | Support | 2x | -1.88% / 6175.0 pips |
| 32.1695 | Support | 2x | -2.13% / 7015.0 pips |
| 31.5685 | Support | 2x | -3.96% / 13025.0 pips |
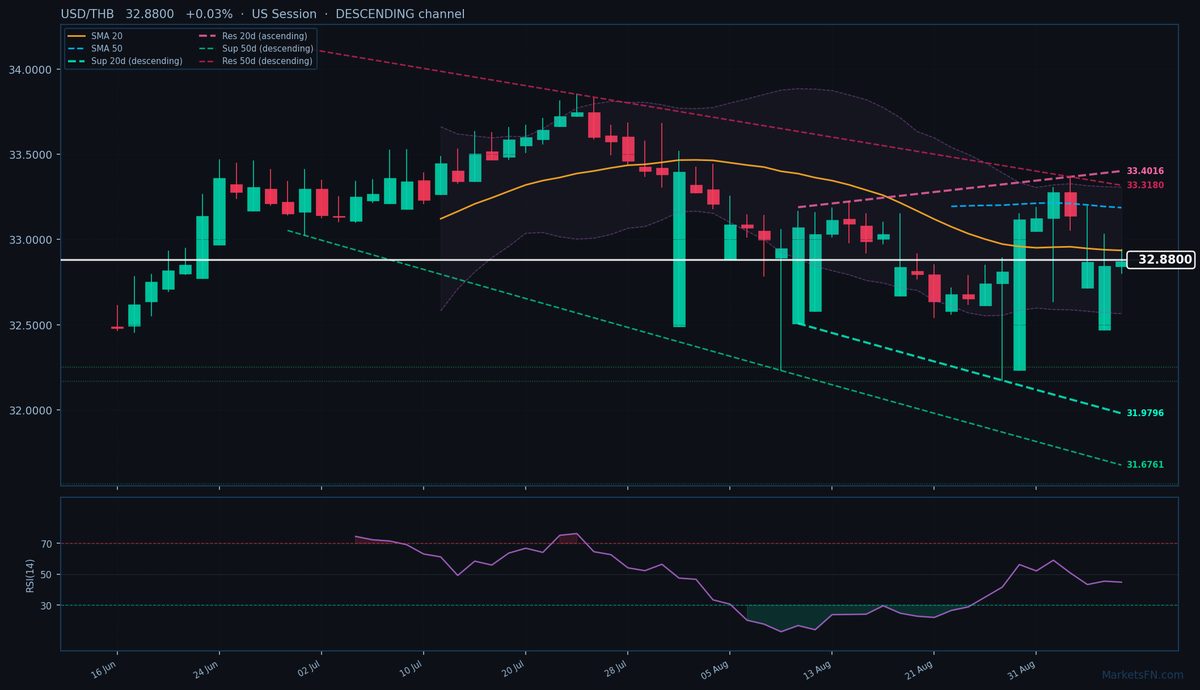
USD/THB is trading at 32.8800 (+0.03%), clinging to the lower half of its 32.8010–32.9420 daily range as European traders test the pair’s bearish momentum. The rate remains firmly below both the SMA-20 (32.9359) and SMA-50 (33.1868), confirming the downtrend’s persistence. A descending 20-day dynamic channel dominates, with resistance at 33.4016 (+1.61%, 5216.2 pips above) and support at 31.9796 (-2.71%, 9004.2 pips below), while the 50-day channel shows even steeper declines (-3.64% to support at 31.6761). Static levels highlight S1 at 32.2535 (6175.0 pips below) as the nearest meaningful floor, though today’s pivot at 32.7813 is the immediate downside reference. RSI(14) at 44.8 suggests neutral momentum, offering no clear divergence to signal exhaustion.
The pair’s failure to reclaim the SMA-20 this week reinforces bearish control, with the 32.9420 session high aligning neatly with this moving average. ATR(14) of 0.3886 implies today’s range is typical, but the absence of bullish follow-through after testing 32.9420 early hints at distribution. Short-term, a break below 32.7813 pivot could accelerate toward S1 at 32.5317, while bulls need a close above 32.9359 (SMA-20) to disrupt the downtrend. The descending 50-day resistance at 33.3180 (+1.36%) remains the structural ceiling. Watch for a close below 32.8010 (today’s low) to confirm bearish continuation toward the 32.2535 static support cluster.
Disclaimer
The content on MarketsFN.com is provided for educational and informational purposes only and does not constitute financial advice. All investments involve risk and past performance does not guarantee future results.