USD/THB: Up 0.02% to 32.8460 — Bearish — Below Key MAs
MarketsFN Team
USD/THB: Up 0.02% to 32.8460 — Bearish — Below Key MAs
Published: September 09, 2026 · MarketsFN Team · US Session · Emerging FX
| Pair | Rate | Change | RSI(14) | SMA-20 | SMA-50 | 52W High | 52W Low | Pivot | R1 | S1 |
|---|---|---|---|---|---|---|---|---|---|---|
| USD/THB | 32.8460 | +0.02% | 51.1 | 32.9105 | 33.1697 | 33.7470 | 30.5160 | 32.8620 | 32.9370 | 32.7650 |
S/R Support & Resistance Levels
Dynamic Trendlines
| Level | Type | Direction | Distance |
|---|---|---|---|
| 31.9837 | 20d Support | down (descending) | -2.63% / 8623.4 pips |
| 33.4241 | 20d Resistance | up (ascending) | +1.76% / 5780.6 pips |
| 31.6463 | 50d Support | down (descending) | -3.65% / 11997.0 pips |
| 33.2849 | 50d Resistance | down (descending) | +1.34% / 4389.3 pips |
Static Levels
| Level | Type | Touches | Distance |
|---|---|---|---|
| 32.2535 | Support | 2x | -1.75% / 5735.0 pips |
| 32.1695 | Support | 2x | -2.00% / 6575.0 pips |
| 31.5685 | Support | 2x | -3.83% / 12585.0 pips |
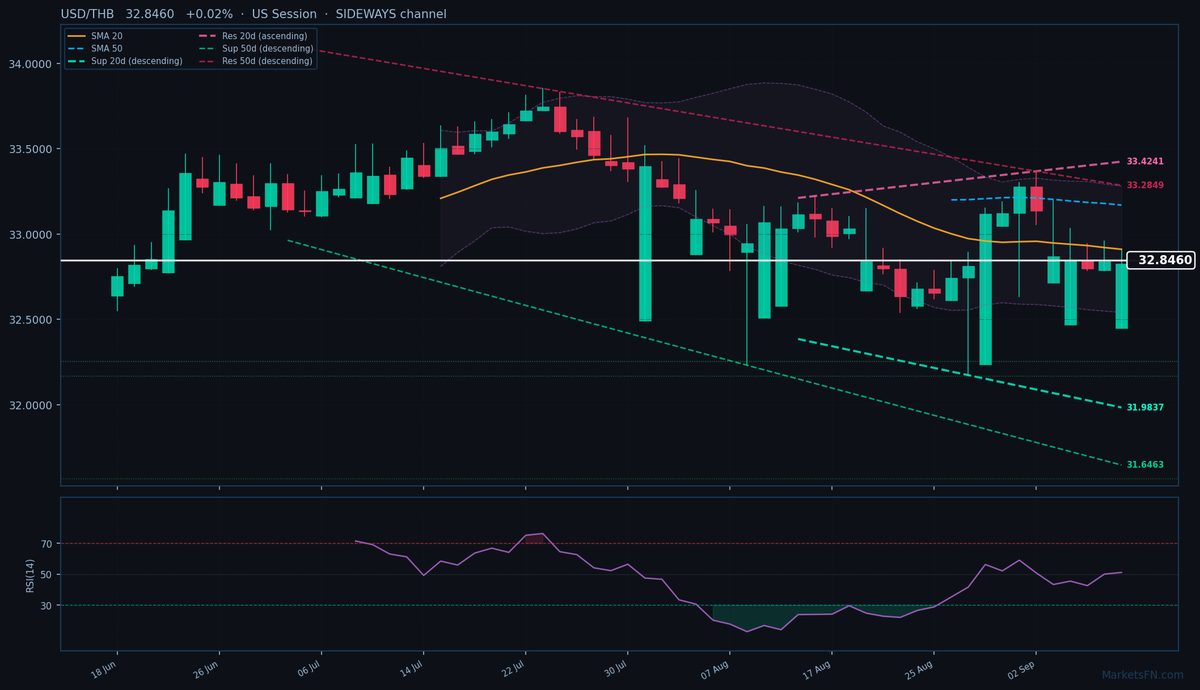
USD/THB is trading at 32.8460 (+0.02%), hovering just below the SMA-20 (32.9105) and SMA-50 (33.1697), confirming the broader downtrend as the pair remains pressured beneath both moving averages. The 20-day dynamic channel is technically sideways, but the 50-day dynamic channel is decisively descending, with resistance at 33.2849 (4389.3 pips above) and support at 31.6463 (11997.0 pips below). The nearer-term 20-day dynamic resistance at 33.4241 (5780.6 pips above) is ascending, suggesting potential for short-term upside pressure if the pair breaks above the SMA-20.
Static levels show immediate resistance at R1 (32.9370, 910 pips above) and support at S1 (32.7650, 810 pips below), though stronger static support sits at 32.2535 (5735.0 pips below). The RSI at 51.1 is neutral, offering no clear momentum bias, while the ATR(14) of 0.3896 indicates subdued volatility.
Short-term, the pair is caught between the descending 50-day channel and the near-flat 20-day channel, with a break above the SMA-20 (32.9105) needed to challenge R1. Failure to hold above S1 (32.7650) could see a retest of the 32.2535 static support. Watch for a decisive move beyond the 20-day dynamic resistance (33.4241) or a breakdown toward the 50-day dynamic support (31.6463) to confirm the next directional bias. The European session’s price action near the pivot (32.8620) will be key for intraday momentum.
Disclaimer
The content on MarketsFN.com is provided for educational and informational purposes only and does not constitute financial advice. All investments involve risk and past performance does not guarantee future results.