USD/SGD: Up 0.25% to 1.2669 — Descending Channel
MarketsFN Team
USD/SGD: Up 0.25% to 1.2669 — Descending Channel
Published: September 10, 2026 · MarketsFN Team · US Session · Emerging FX
| Pair | Rate | Change | RSI(14) | SMA-20 | SMA-50 | 52W High | 52W Low | Pivot | R1 | S1 |
|---|---|---|---|---|---|---|---|---|---|---|
| USD/SGD | 1.2669 | +0.25% | 39.9 | 1.2700 | 1.2803 | 1.3075 | 1.2595 | 1.2639 | 1.2650 | 1.2626 |
S/R Support & Resistance Levels
Dynamic Trendlines
| Level | Type | Direction | Distance |
|---|---|---|---|
| 1.2624 | 20d Support | down (descending) | -0.36% / 45.1 pips |
| 1.2712 | 20d Resistance | down (descending) | +0.34% / 43.0 pips |
| 1.2593 | 50d Support | down (descending) | -0.60% / 76.3 pips |
| 1.2696 | 50d Resistance | down (descending) | +0.21% / 27.1 pips |
Static Levels
| Level | Type | Touches | Distance |
|---|---|---|---|
| 1.2936 | Resistance | 2x | +2.30% / 291.4 pips |
| 1.2899 | Resistance | 2x | +2.01% / 254.6 pips |
| 1.2840 | Resistance | 2x | +1.55% / 196.0 pips |
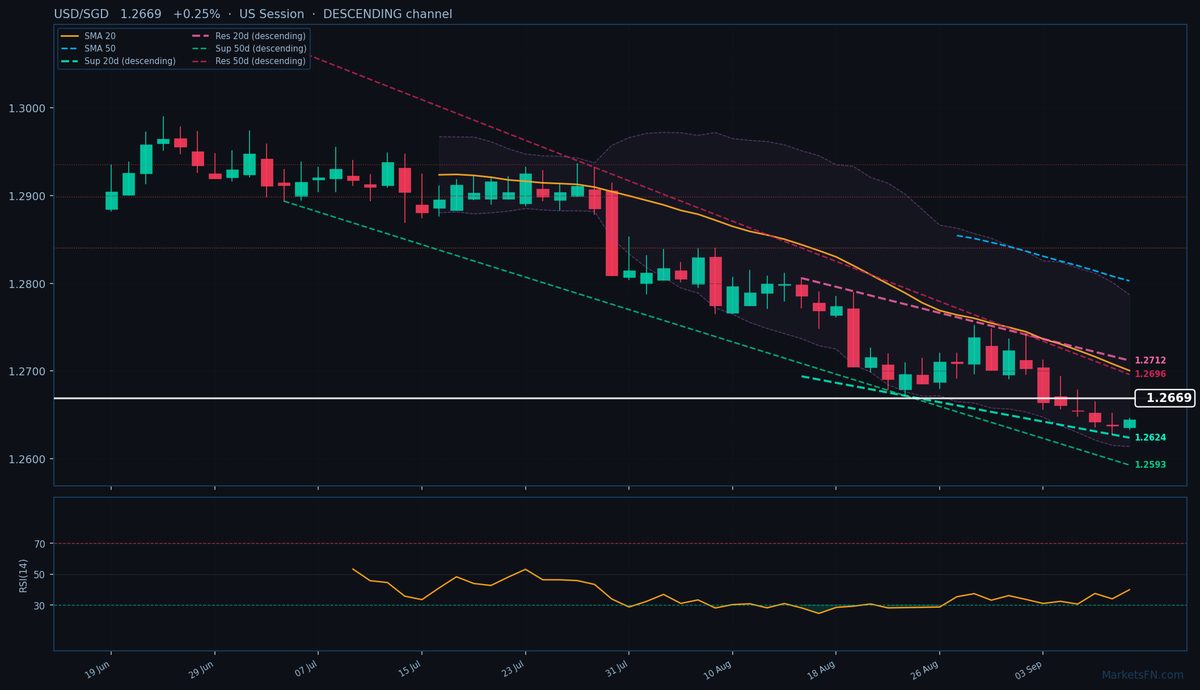
USD/SGD is trading at 1.2669 (+0.25%), testing the upper bounds of today’s 1.2633–1.2646 range as it grinds against a persistent downtrend. The pair remains firmly below both the 20-day SMA (1.2700, -31.1 pips) and 50-day SMA (1.2803, -134.4 pips), confirming the bearish bias. Price action is trapped within a descending 20-day dynamic channel, with immediate resistance at 1.2712 (+43.0 pips) and support at 1.2624 (-45.1 pips). The broader 50-day channel mirrors this structure, sloping downward with resistance at 1.2696 (+27.1 pips) and support at 1.2593 (-76.3 pips). Static levels show S1 at 1.2626 (-43.3 pips) and R1 at 1.2650 (-18.9 pips), though more consequential resistance clusters loom at 1.2840 (+196.0 pips) and beyond.
RSI at 39.9 sits in neutral territory, offering no clear momentum divergence to challenge the downtrend. With ATR(14) at just 0.0037, volatility remains subdued, suggesting range-bound trading may persist near-term. The key test is whether buyers can sustain a break above the 20-day dynamic resistance (1.2712), which would threaten the descending channel’s integrity. Failure to hold above today’s pivot (1.2639) risks a retest of the 20-day dynamic support (1.2624), aligning with the 52-week low of 1.2595. Watch for a close above 1.2700 (20-day SMA) to signal potential trend exhaustion, while a breakdown below 1.2624 would reinforce bearish control. The European session’s price action will set the tone for whether this rebound has legs or merely delays the next leg lower.
Disclaimer
The content on MarketsFN.com is provided for educational and informational purposes only and does not constitute financial advice. All investments involve risk and past performance does not guarantee future results.