USD/SGD: Down 0.13% to 1.2772 — Ascending Channel
MarketsFN Team
USD/SGD: Down 0.13% to 1.2772 — Ascending Channel
Published: October 20, 2026 · MarketsFN Team · US Session · Emerging FX
| Pair | Rate | Change | RSI(14) | SMA-20 | SMA-50 | 52W High | 52W Low | Pivot | R1 | S1 |
|---|---|---|---|---|---|---|---|---|---|---|
| USD/SGD | 1.2772 | -0.13% | 54.2 | 1.2787 | 1.2746 | 1.3075 | 1.2595 | 1.2799 | 1.2816 | 1.2772 |
S/R Support & Resistance Levels
Dynamic Trendlines
| Level | Type | Direction | Distance |
|---|---|---|---|
| 1.2779 | 20d Support | flat (flat) | +0.05% / 6.7 pips |
| 1.2882 | 20d Resistance | up (ascending) | +0.86% / 109.9 pips |
| 1.2716 | 50d Support | up (ascending) | -0.44% / 56.0 pips |
| 1.2874 | 50d Resistance | flat (flat) | +0.80% / 101.6 pips |
Static Levels
| Level | Type | Touches | Distance |
|---|---|---|---|
| 1.2936 | Resistance | 2x | +1.10% / 141.2 pips |
| 1.2840 | Resistance | 2x | +0.36% / 45.7 pips |
| 1.2810 | Resistance | 2x | +0.12% / 15.1 pips |
| 1.2788 | Support | 2x | -0.06% / 7.1 pips |
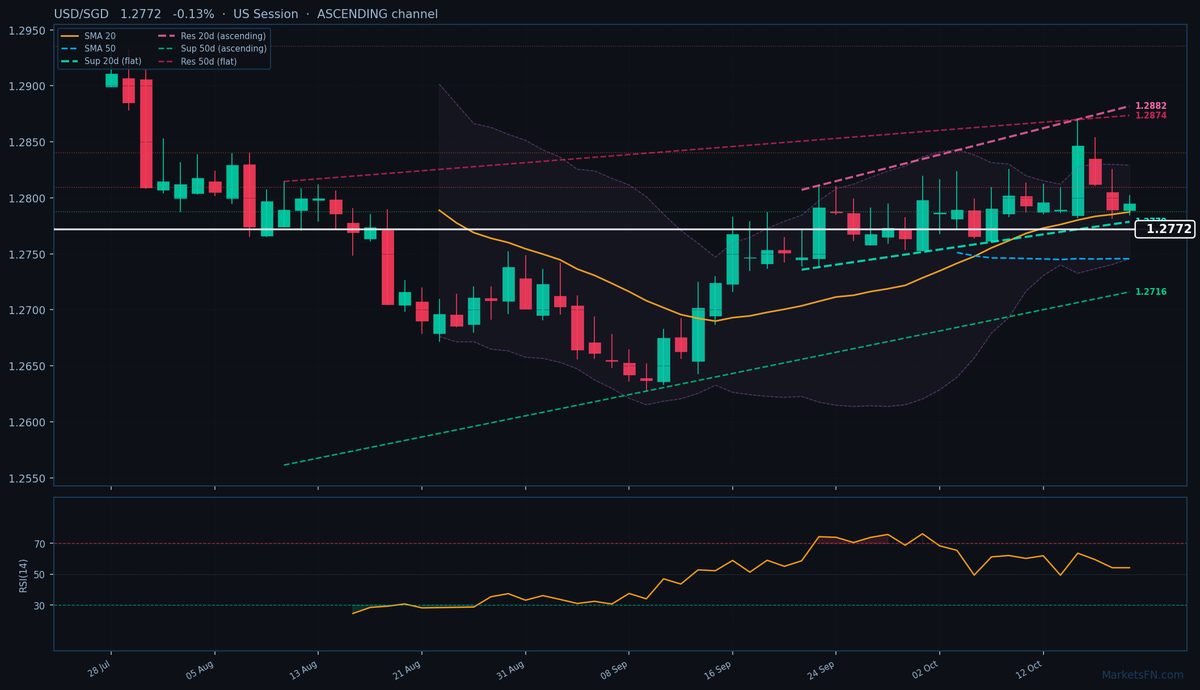
USD/SGD is trading at 1.2772 (-0.13%), testing the lower bounds of its recent consolidation phase as it flirts with the 20-day SMA at 1.2787. The pair remains trapped between its 20-day (1.2787) and 50-day (1.2746) moving averages, reflecting indecision after last week’s failed breakout attempt above 1.2800. Price action is currently 6.7 pips above the 20-day dynamic support at 1.2779, while the ascending 20-day resistance looms 109.9 pips higher at 1.2882 — a level that’s risen steadily since early October. The 50-day channel paints a more neutral picture, with support at 1.2716 (-56.0 pips) and resistance at 1.2874 (+101.6 pips) forming a sideways corridor.
Static levels show immediate congestion, with S1 support at 1.2788 just 7.1 pips above current trading, while R1 resistance at 1.2810 sits 15.1 pips overhead — both levels have been tested twice recently, confirming their relevance. The RSI at 54.2 suggests neutral momentum, though the pair’s failure to hold above the 20-day SMA hints at near-term bearish pressure.
With the European session failing to spark directional conviction, the immediate risk is a retest of the 50-day SMA at 1.2746 (-26 pips), which aligns with the ascending 50-day dynamic support. A break below 1.2779 would confirm near-term weakness, while reclaiming 1.2816 (R1 pivot) could revive bullish attempts toward the 20-day dynamic resistance. Watch for a close above 1.2799 (today’s pivot) to gauge whether consolidation is resolving upward.
Disclaimer
The content on MarketsFN.com is provided for educational and informational purposes only and does not constitute financial advice. All investments involve risk and past performance does not guarantee future results.