USD/SGD: Down 0.08% to 1.2648 — Descending Channel
MarketsFN Team
USD/SGD: Down 0.08% to 1.2648 — Descending Channel
Published: September 08, 2026 · MarketsFN Team · US Session · Emerging FX
| Pair | Rate | Change | RSI(14) | SMA-20 | SMA-50 | 52W High | 52W Low | Pivot | R1 | S1 |
|---|---|---|---|---|---|---|---|---|---|---|
| USD/SGD | 1.2648 | -0.08% | 30.9 | 1.2724 | 1.2820 | 1.3075 | 1.2595 | 1.2671 | 1.2684 | 1.2647 |
S/R Support & Resistance Levels
Dynamic Trendlines
| Level | Type | Direction | Distance |
|---|---|---|---|
| 1.2615 | 20d Support | down (descending) | -0.26% / 33.3 pips |
| 1.2727 | 20d Resistance | down (descending) | +0.62% / 78.7 pips |
| 1.2611 | 50d Support | down (descending) | -0.29% / 36.9 pips |
| 1.2736 | 50d Resistance | down (descending) | +0.69% / 87.8 pips |
Static Levels
| Level | Type | Touches | Distance |
|---|---|---|---|
| 1.2936 | Resistance | 2x | +2.20% / 278.1 pips |
| 1.2899 | Resistance | 2x | +1.91% / 241.2 pips |
| 1.2840 | Resistance | 2x | +1.44% / 182.6 pips |
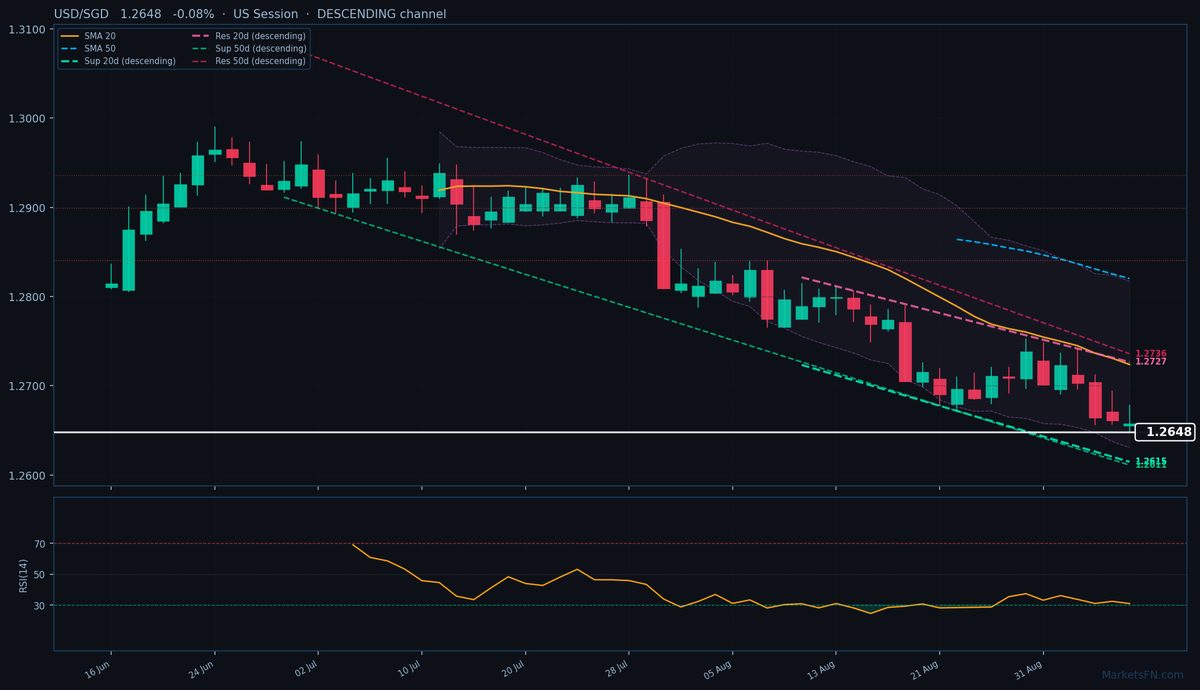
USD/SGD is trading at 1.2648 (-0.08%), continuing its downtrend as the pair remains firmly below both the 20-day SMA (1.2724, -76 pips) and 50-day SMA (1.2820, -172 pips). The descending dynamic channel confirms bearish momentum, with current price hovering just 33.3 pips above the 20-day dynamic support trendline at 1.2615 and 78.7 pips below the descending 20-day resistance at 1.2727. The broader 50-day channel shows similar structure, with resistance at 1.2736 (+87.8 pips) and support at 1.2611 (-36.9 pips).
Static levels highlight immediate downside potential, with S1 pivot support at 1.2647 (-0.1 pips) nearly breached and R1 resistance at 1.2684 (+36 pips) capping rebounds. The RSI at 30.9 sits in neutral territory but leans toward oversold, suggesting limited downside momentum unless the pair breaks below the dynamic support cluster around 1.2611–1.2615.
Short-term outlook remains bearish within the descending channel, with a test of the 1.2611–1.2615 support zone likely if European session selling persists. A break below could target the 52-week low of 1.2595 (-53 pips), while any rebound would need to clear 1.2684 (R1) to challenge the dynamic resistance at 1.2727. Watch for a close below 1.2647 (S1) to confirm bearish continuation.
Disclaimer
The content on MarketsFN.com is provided for educational and informational purposes only and does not constitute financial advice. All investments involve risk and past performance does not guarantee future results.