USD/MXN: Up 0.87% to 18.5671 — Ascending Channel
MarketsFN Team
USD/MXN: Up 0.87% to 18.5671 — Ascending Channel
Published: October 21, 2026 · MarketsFN Team · US Session · Emerging FX
| Pair | Rate | Change | RSI(14) | SMA-20 | SMA-50 | 52W High | 52W Low | Pivot | R1 | S1 |
|---|---|---|---|---|---|---|---|---|---|---|
| USD/MXN | 18.5671 | +0.87% | 59.0 | 18.1942 | 17.5000 | 18.6856 | 16.8835 | 18.4320 | 18.4923 | 18.3472 |
S/R Support & Resistance Levels
Dynamic Trendlines
| Level | Type | Direction | Distance |
|---|---|---|---|
| 18.3447 | 20d Support | up (ascending) | -1.20% / 2223.8 pips |
| 18.6966 | 20d Resistance | up (ascending) | +0.70% / 1295.1 pips |
| 18.0231 | 50d Support | up (ascending) | -2.93% / 5440.1 pips |
| 18.9990 | 50d Resistance | up (ascending) | +2.33% / 4319.0 pips |
Static Levels
| Level | Type | Touches | Distance |
|---|---|---|---|
| 17.8683 | Support | 2x | -3.76% / 6987.6 pips |
| 17.1529 | Support | 2x | -7.62% / 14141.9 pips |
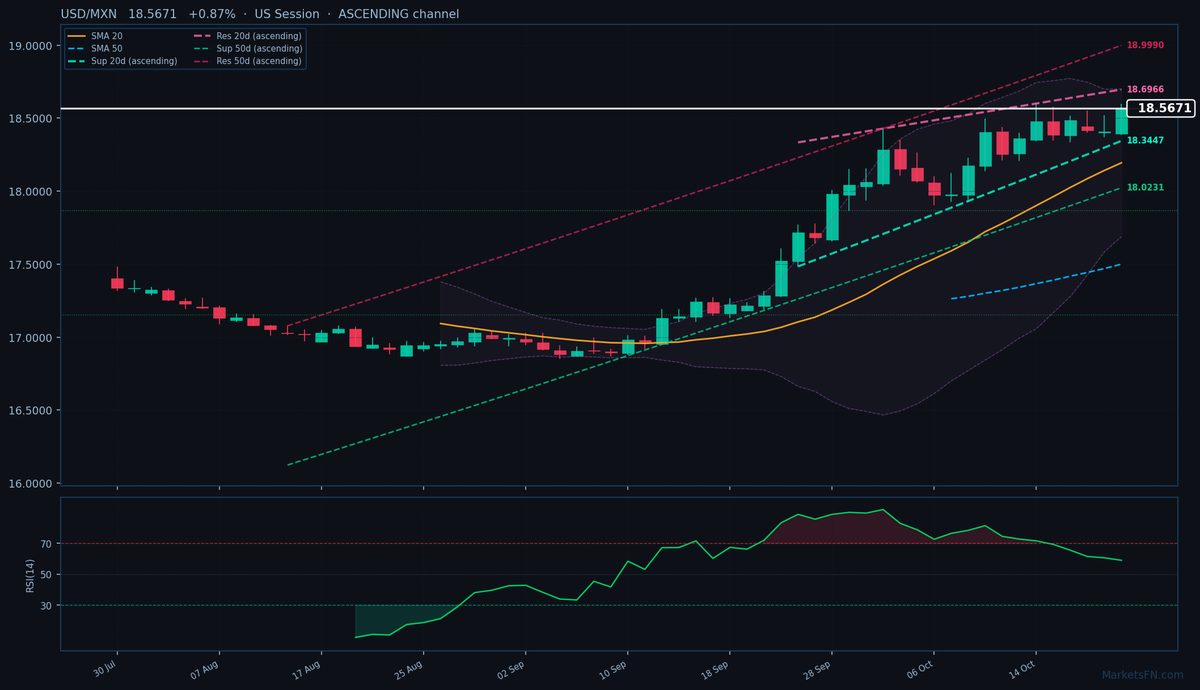
USD/MXN is trading at 18.5671 (+0.87%), extending its bullish momentum as it tests the upper bounds of its ascending 20-day dynamic channel. The pair is firmly above both the SMA-20 (18.1942) and SMA-50 (17.5000), confirming the uptrend’s strength, while the RSI at 59.0 leaves room for further upside before overbought conditions emerge. Immediate resistance lies at the 20-day dynamic trendline of 18.6966 (+0.70%, 1295.1 pips away), with a break above potentially targeting the 52-week high of 18.6856. Conversely, the nearest dynamic support sits at 18.3447 (-1.20%, 2223.8 pips below), aligning closely with today’s S1 pivot at 18.3472.
The broader 50-day channel remains ascending, with resistance at 18.9990 (+2.33%, 4319.0 pips away) and support at 18.0231 (-2.93%, 5440.1 pips below). Static levels are less relevant near-term, with the closest notable support at 17.8683 (6987.6 pips away). Today’s push above the R1 pivot (18.4923) suggests bullish conviction, though the ATR(14) of 0.2156 indicates volatility could temper gains.
Short-term, the pair’s trajectory hinges on whether it sustains above 18.5671 to challenge the 20-day resistance. A rejection here may see a retest of the 20-day SMA (18.1942), but the ascending channel and MA alignment favor continuation. Watch for a close above 18.5936 (today’s high) to confirm further upside, while a break below 18.3447 would signal a potential trend reversal.
Disclaimer
The content on MarketsFN.com is provided for educational and informational purposes only and does not constitute financial advice. All investments involve risk and past performance does not guarantee future results.