USD/SGD: Up 0.06% to 1.2773 — Ascending Channel
MarketsFN Team
USD/SGD: Up 0.06% to 1.2773 — Ascending Channel
Published: October 21, 2026 · MarketsFN Team · US Session · Emerging FX
| Pair | Rate | Change | RSI(14) | SMA-20 | SMA-50 | 52W High | 52W Low | Pivot | R1 | S1 |
|---|---|---|---|---|---|---|---|---|---|---|
| USD/SGD | 1.2773 | +0.06% | 50.4 | 1.2788 | 1.2745 | 1.3075 | 1.2595 | 1.2792 | 1.2800 | 1.2782 |
S/R Support & Resistance Levels
Dynamic Trendlines
| Level | Type | Direction | Distance |
|---|---|---|---|
| 1.2765 | 20d Support | flat (flat) | -0.06% / 7.4 pips |
| 1.2886 | 20d Resistance | up (ascending) | +0.89% / 113.1 pips |
| 1.2734 | 50d Support | up (ascending) | -0.30% / 38.8 pips |
| 1.2875 | 50d Resistance | flat (flat) | +0.80% / 102.5 pips |
Static Levels
| Level | Type | Touches | Distance |
|---|---|---|---|
| 1.2936 | Resistance | 2x | +1.33% / 170.3 pips |
| 1.2840 | Resistance | 2x | +0.59% / 74.8 pips |
| 1.2810 | Resistance | 2x | +0.35% / 44.3 pips |
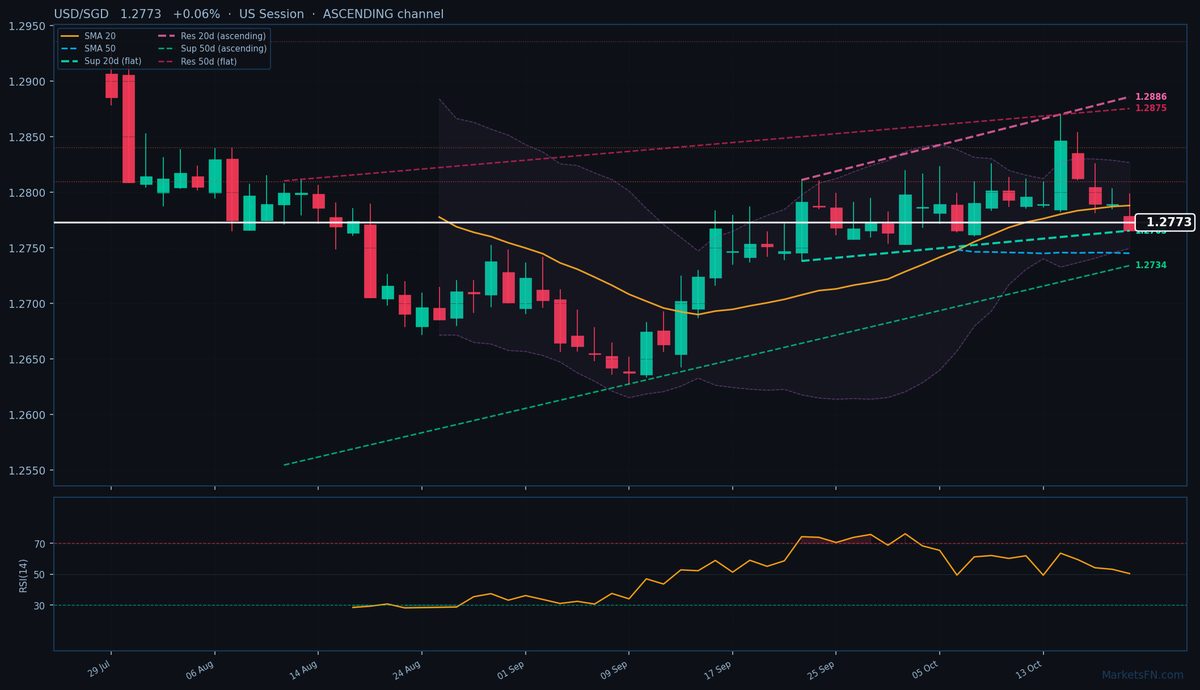
USD/SGD is trading at 1.2773 (+0.06%), caught in a consolidation phase between its 20-day SMA (1.2788, 15 pips above) and 50-day SMA (1.2745, 28 pips below). The pair is struggling for direction, with today’s 34-pip range (1.2765–1.2798) barely exceeding the 14-day ATR of 42 pips, confirming indecision.
The 20-day dynamic channel is ascending, with immediate resistance at 1.2886 (113 pips away) and flat support at 1.2765 (just 7 pips below). The 50-day channel paints a more neutral picture—sideways with ascending support at 1.2734 (39 pips below) and flat resistance at 1.2875 (102 pips above). Static levels show R1 at 1.2810 (44 pips away) as the nearest hurdle, while S1 at 1.2782 (9 pips below) offers minor intraday support.
RSI at 50.4 confirms neutral momentum, but the failure to hold above the 20-day SMA suggests weak bullish conviction. With the rate trapped between dynamic and static levels, the path of least resistance remains sideways unless either 1.2734 (50-day support) or 1.2810 (static R1) breaks decisively.
Watch for a close above 1.2798 (today’s high) to test R1, while a break below 1.2765 (today’s low) could trigger a retest of the 50-day SMA. The European session’s price action will set the tone—failure to reclaim 1.2788 (20-day SMA) would signal continued range-bound trading.
Disclaimer
The content on MarketsFN.com is provided for educational and informational purposes only and does not constitute financial advice. All investments involve risk and past performance does not guarantee future results.