USD/MXN: Up 0.16% to 16.9385 — Descending Channel
MarketsFN Team
USD/MXN: Up 0.16% to 16.9385 — Descending Channel
Published: September 08, 2026 · MarketsFN Team · US Session · Emerging FX
| Pair | Rate | Change | RSI(14) | SMA-20 | SMA-50 | 52W High | 52W Low | Pivot | R1 | S1 |
|---|---|---|---|---|---|---|---|---|---|---|
| USD/MXN | 16.9385 | +0.16% | 34.0 | 16.9788 | 17.2337 | 18.6856 | 16.8835 | 16.8923 | 16.9296 | 16.8462 |
S/R Support & Resistance Levels
Dynamic Trendlines
| Level | Type | Direction | Distance |
|---|---|---|---|
| 16.8135 | 20d Support | down (descending) | -0.74% / 1250.1 pips |
| 17.0195 | 20d Resistance | down (descending) | +0.48% / 809.5 pips |
| 16.7290 | 50d Support | down (descending) | -1.24% / 2095.9 pips |
| 17.0204 | 50d Resistance | down (descending) | +0.48% / 818.9 pips |
Static Levels
| Level | Type | Touches | Distance |
|---|---|---|---|
| 17.5648 | Resistance | 2x | +3.86% / 6525.0 pips |
| 17.5352 | Resistance | 2x | +3.68% / 6229.1 pips |
| 17.4358 | Resistance | 2x | +3.10% / 5235.1 pips |
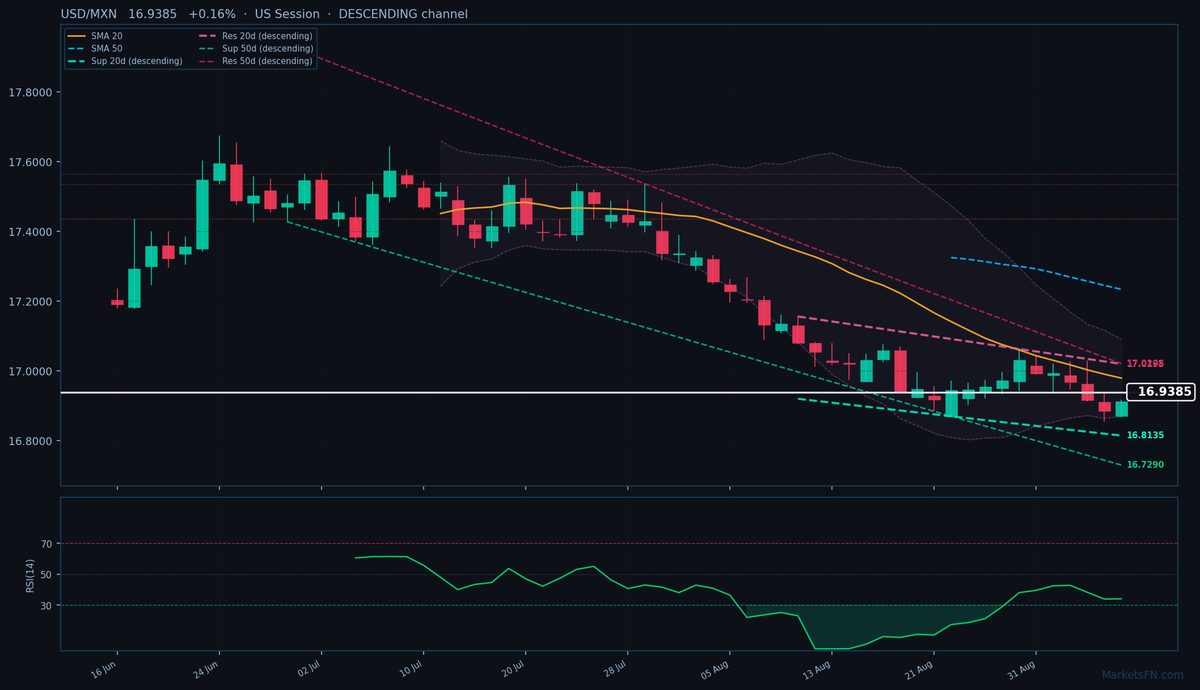
USD/MXN is trading at 16.9385 (+0.16%), testing the lower bounds of a well-defined descending channel as bearish momentum persists. The pair remains below both the 20-day (16.9788) and 50-day (17.2337) SMAs, confirming the downtrend, with the 50-day SMA exerting stronger resistance. Price action is currently 809.5 pips below the 20-day descending dynamic resistance trendline (17.0195) and 1250.1 pips above the 20-day descending dynamic support (16.8135), reinforcing the bearish bias. The 50-day channel mirrors this structure, with resistance at 17.0204 (+0.64%, 818.9 pips away) and support at 16.7290 (-1.08%, 2095.9 pips away).
Static levels highlight near-term pivot points, with S1 at 16.8462 (-922.3 pips) and R1 at 16.9296 (-89.1 pips), though neither has been tested in today’s session. The RSI at 34.0 sits in neutral territory, suggesting room for further downside before oversold conditions emerge. With the ATR(14) at 0.0797, volatility remains contained, but a break below the 20-day dynamic support could accelerate selling toward the 52-week low of 16.8835 (-547.0 pips).
Short-term, the descending channel and SMA positioning favor sellers, but a close above the 20-day SMA (16.9788, +403.0 pips) could signal a temporary reprieve. Watch for a test of S1 (16.8462) or a rejection at R1 (16.9296) to confirm the next leg. The European session’s price action will set the tone for whether the downtrend extends or consolidates.
Disclaimer
The content on MarketsFN.com is provided for educational and informational purposes only and does not constitute financial advice. All investments involve risk and past performance does not guarantee future results.