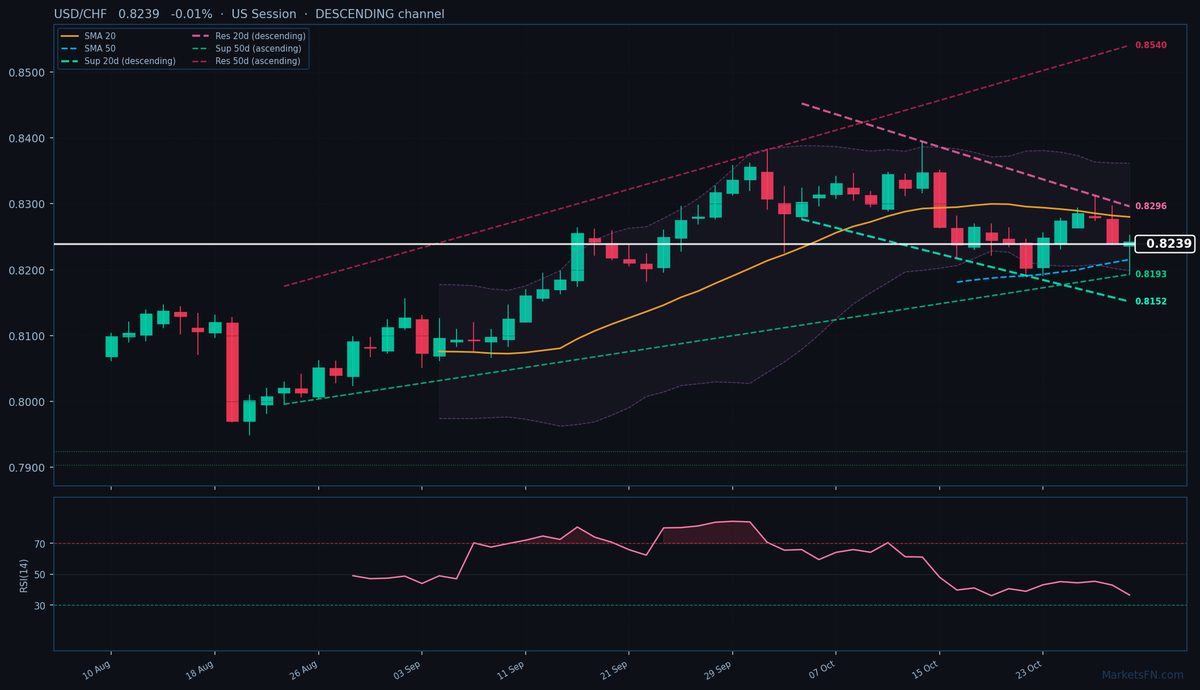
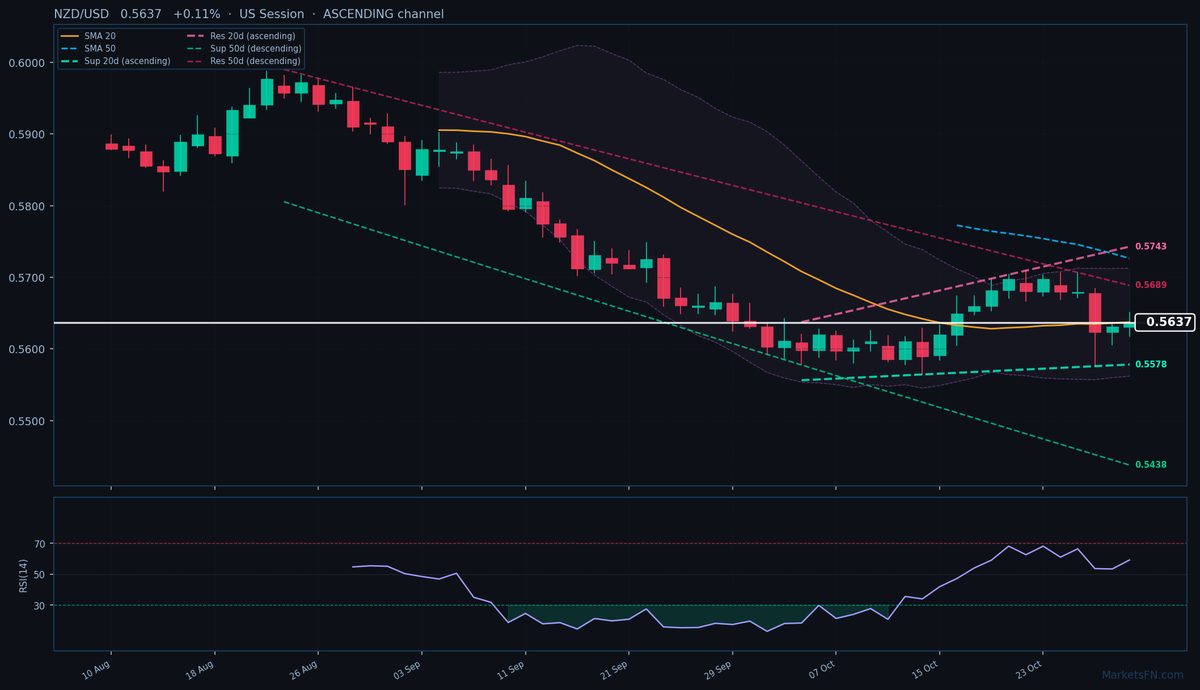
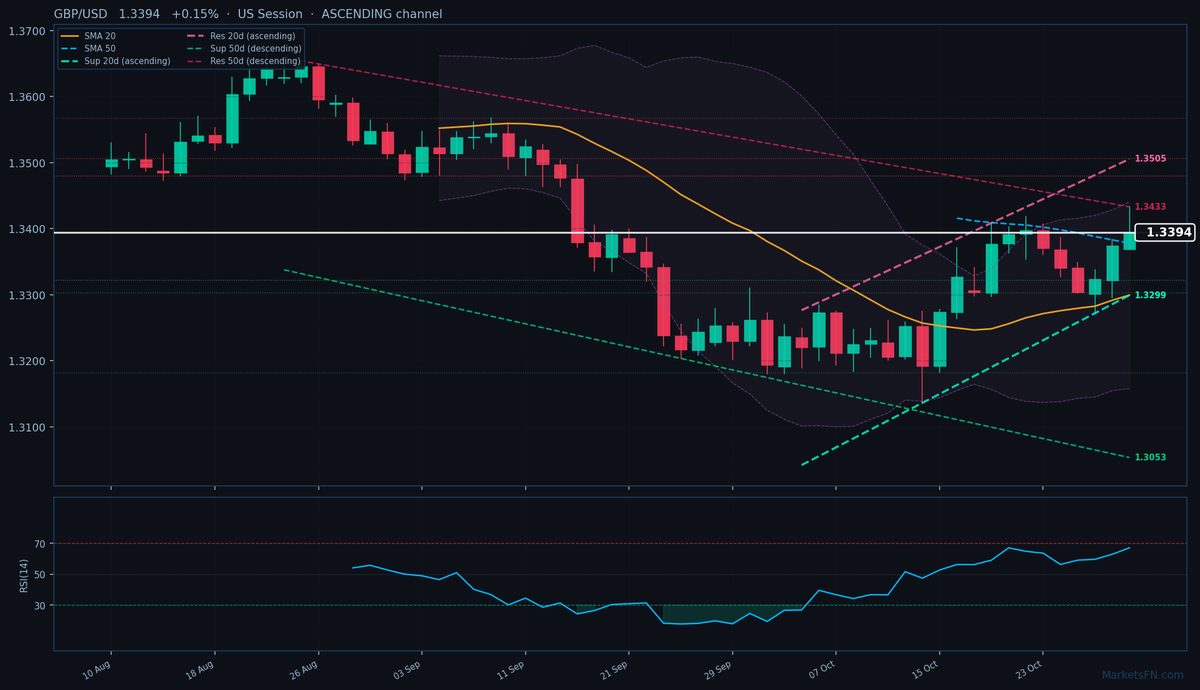
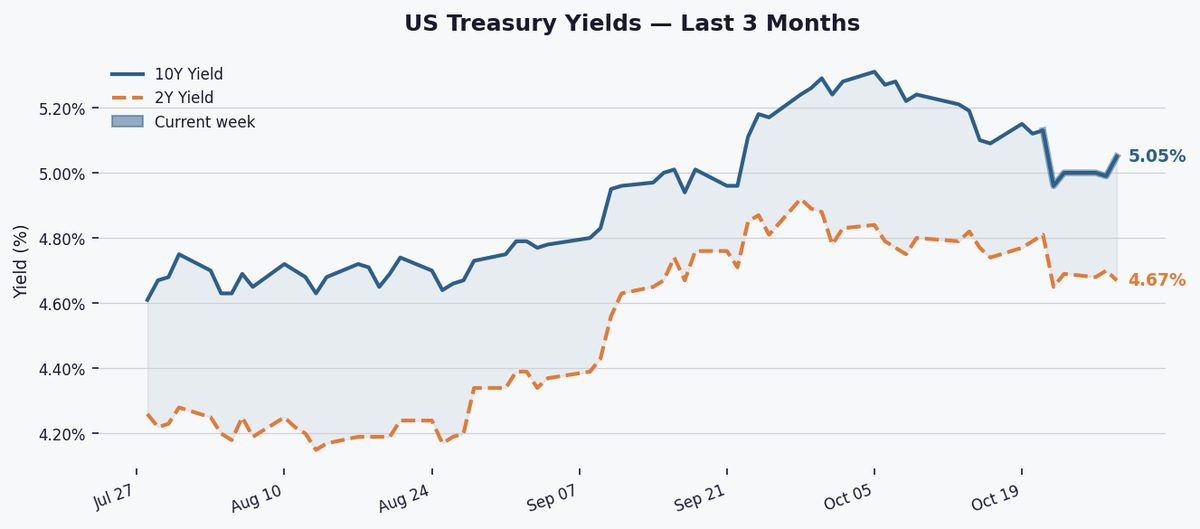
USD/JPY: Down 0.14% to 157.47 — Descending Channel
MarketsFN Team
USD/JPY: Down 0.14% to 157.47 — Descending Channel
Published: October 30, 2026 · MarketsFN Team · US Session
| Pair | Rate | Change | RSI(14) | SMA-20 | SMA-50 | 52W High | 52W Low | Pivot | R1 | S1 |
|---|---|---|---|---|---|---|---|---|---|---|
| USD/JPY | 157.47 | -0.14% | 35.6 | 157.89 | 157.41 | 163.84 | 152.16 | 157.80 | 158.01 | 157.48 |
📊 Support & Resistance Levels
Dynamic Trendlines
| Level | Type | Direction | Distance |
|---|---|---|---|
| 155.59 | 20d Support | ↘ descending | -1.20% / 188.6 pips |
| 158.22 | 20d Resistance | ↘ descending | +0.47% / 74.5 pips |
| 154.93 | 50d Support | ↗ ascending | -1.62% / 254.5 pips |
| 158.37 | 50d Resistance | ↘ descending | +0.57% / 89.6 pips |
Static Levels
| Level | Type | Touches | Distance |
|---|---|---|---|
| 159.85 | Resistance | 2× | +1.64% / 258.5 pips |
| 157.91 | Resistance | 2× | +0.41% / 64.7 pips |
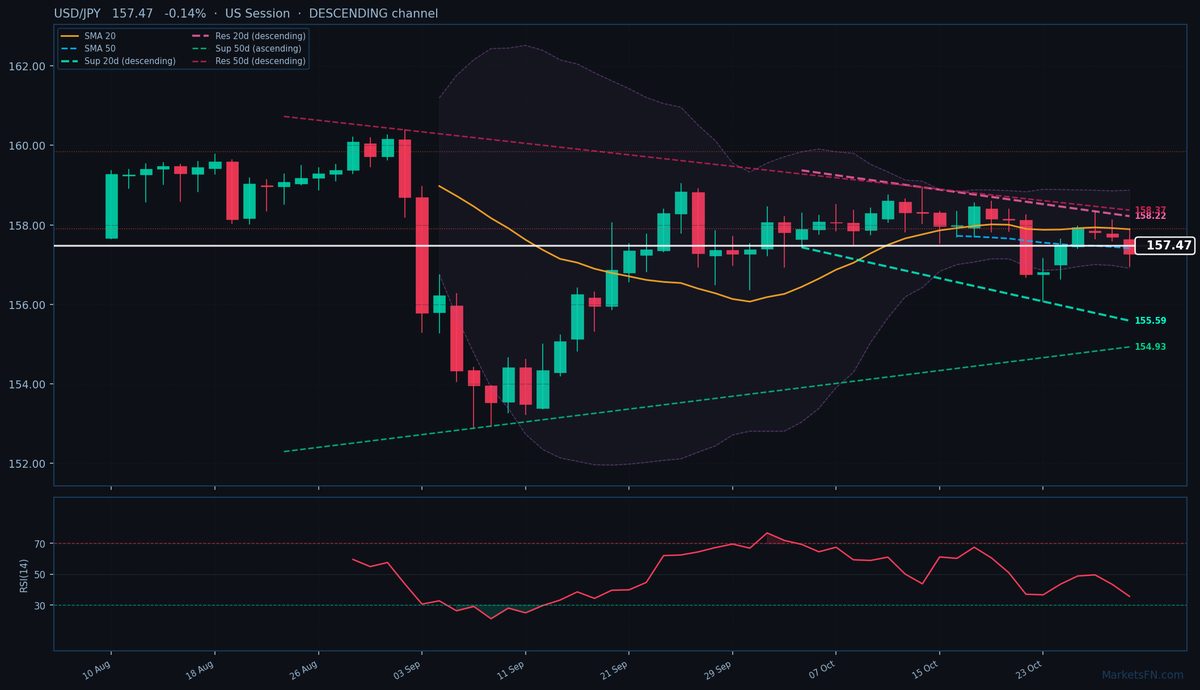
USD/JPY is trading at 157.47 (-0.14%), trapped in a consolidation phase as it oscillates between the SMA-50 (157.41) and SMA-20 (157.89) — a 48-pip compression zone signaling indecision. The pair is testing the lower bound of a descending 20-day channel (resistance at 158.22, +74.5 pips; support at 155.59, -188.6 pips), while the 50-day channel shows conflicting signals with ascending support (154.93, -254.5 pips) but descending resistance (158.37, +89.6 pips). This technical tug-of-war reflects the market’s struggle to price in divergent Fed/BoJ policy expectations.
Static levels highlight immediate battlegrounds: S1 at 157.48 (just 1 pip below current) offers negligible support, while R1 at 157.91 (44 pips above) aligns with the SMA-20 — a confluence resistance zone. The RSI at 35.6 shows neutral momentum, but the descending channel and price below the SMA-20 tilt short-term bias bearish. A break below S1 could accelerate toward the 20-day dynamic support at 155.59 (-188.6 pips), though the ascending 50-day trendline at 154.93 (-254.5 pips) should limit downside.
The catalyst for direction will be Thursday’s US core PCE print — a hot reading could revive USD momentum toward 158.22 (20-day resistance), while a miss may test 156.96 (today’s low). Until then, expect choppy range-trading between 157.48-157.89.
Disclaimer
The content on MarketsFN.com is provided for educational and informational purposes only and does not constitute financial advice. All investments involve risk and past performance does not guarantee future results.